Simpson's Paradox: Election Day Edition
by meep
I love a good Simpson’s Paradox example out in the wild, and here is a perfect one a friend sent me:
MICHIGAN absentee ballot *****return**** rate
— umichvoter (@umichvoter) November 3, 2022
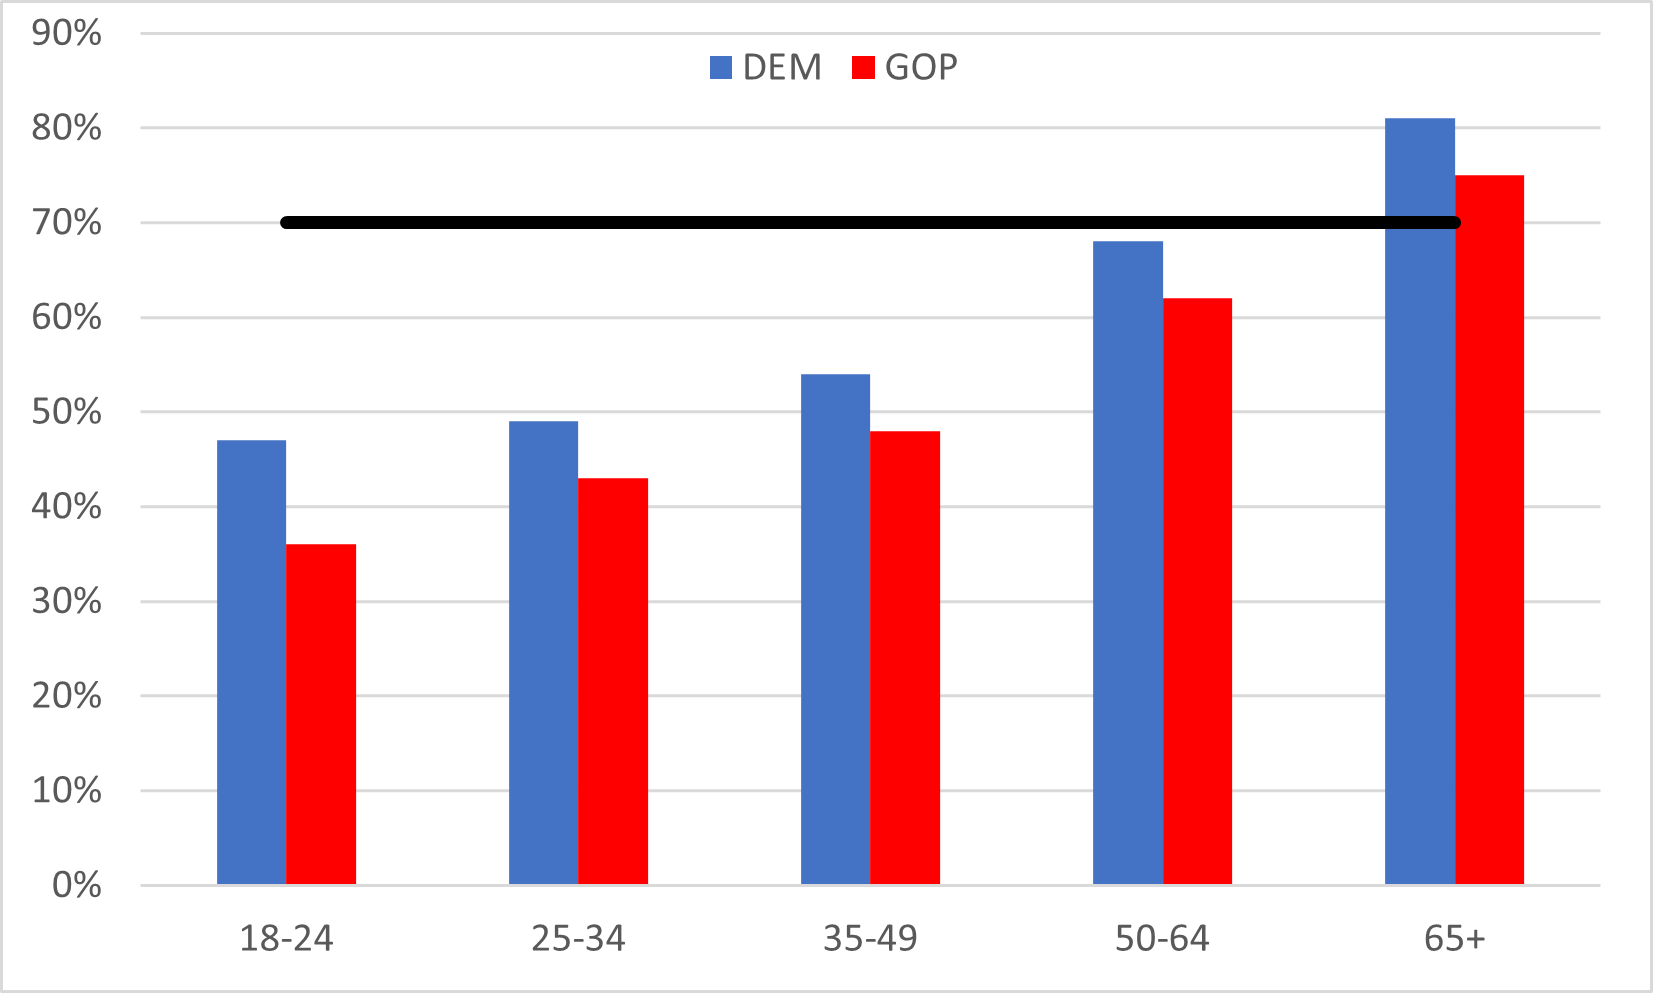
18-24: DEM 47%, GOP 36%
25-34: DEM 49%, GOP 43%
35-49: DEM 54%, GOP 48%
50-64: DEM 68%, GOP 62%
65+: DEM 81%, GOP 75%
TOTAL: DEM 70%, GOP 70%
fun little statistical paradox
This one will be very easy to explain, because I found some Michigan stats from 2020 absentee ballots.
If you don’t understand how this is a “paradox”, the short version is this:
- In the aggregate, the Democratic and Republican return rates are equal.
- But for each age subgroup, the Democratic return rate is higher than the Republican rate, sometimes by quite a lot.
Here’s a graph of the return rates by age group, with a black line across being the aggregate rate overall:
Most absentee voters in Michigan are old
The first giveaway, though, is that the aggregate return rate for both Democrats and Republicans is 70%.
That’s way higher than the return rate for ages 18 – 49 for both parties. You can see that right away on the graph.
It’s within spitting range for ages 50 – 64, especially for the Democrats (hint hint). It’s still some distance for the Republicans.
And for ages 65+, obviously, it’s above 70% for both parties. That’s the only way the aggregate rate can be 70% given the other groups have rates below 70%.
So I decided to see if I could find what the age distribution of absentee voters are in Michigan, and I found it:
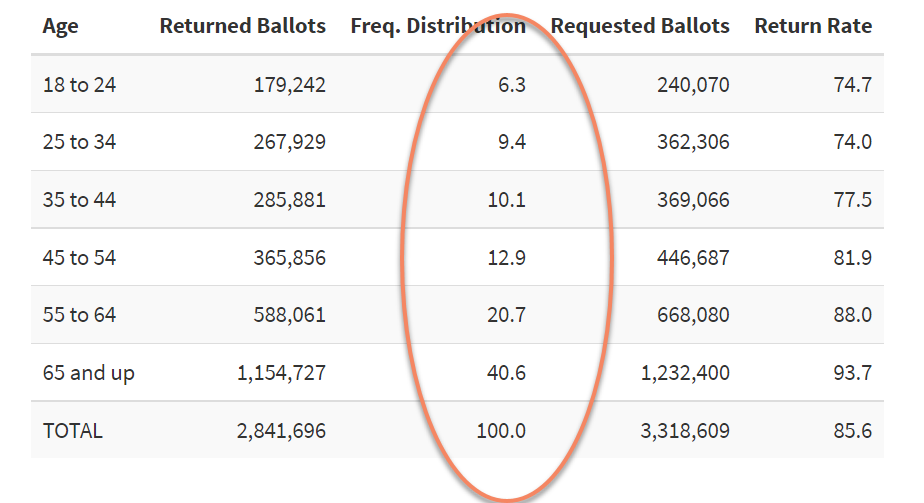
That’s from 2020 absentee ballot results. I circled the age distribution of the ballot requests.
Now you can see what’s going on — 41% of the requested absentee ballots were from people aged 65 and over in 2020. The absentee ballot requests are skewed toward old voters.
When absentee ballots are only by request, and when most people wanting absentee ballots may have a certain level of physical disability in getting to the polls, it makes sense that it’s mostly fairly old people requesting absentee ballots.
It’s only in states where everybody automatically gets mail-in ballots where you’re not going to get this old-biased distribution.
Making the math work
Now that we can see what the 2020 age distribution looked like overall, we can come up with distributions for both parties that make sense and make the math work.
There are multiple solutions to make it work for each party, but they’re all very close, so I will just show one solution for each party.
Democrats:- Age 18- 24: 5%
- Age 25 – 34: 7%
- Age 35 – 49: 15%
- Age 50 – 64: 25%
- Age 65+: 48%
Let’s try out the math — first, make sure the weights add up to 100% (5% + 7% + 15% + 25% + 48% do).
Second, do the weighted average — 5% * 47% + 7% * 49% + 15% * 54% + 25% * 68% + 48% * 81% = 70%
(Okay, it’s 69.76%, but that’s close enough for rounding — you can solve exactly, and I’m not going to bother. I wanted nice round numbers.)
Republicans:- Age 18- 24: 1%
- Age 25 – 34: 3%
- Age 35 – 49: 7%
- Age 50 – 64: 15%
- Age 65+: 74%
I’ll leave it to you to do the math to check that one.
If you think about it for a moment, with the Republican absentee ballots skewing much older than the Democrats, that makes sense, too.
Here’s a graph with the weights flipped below the axis:
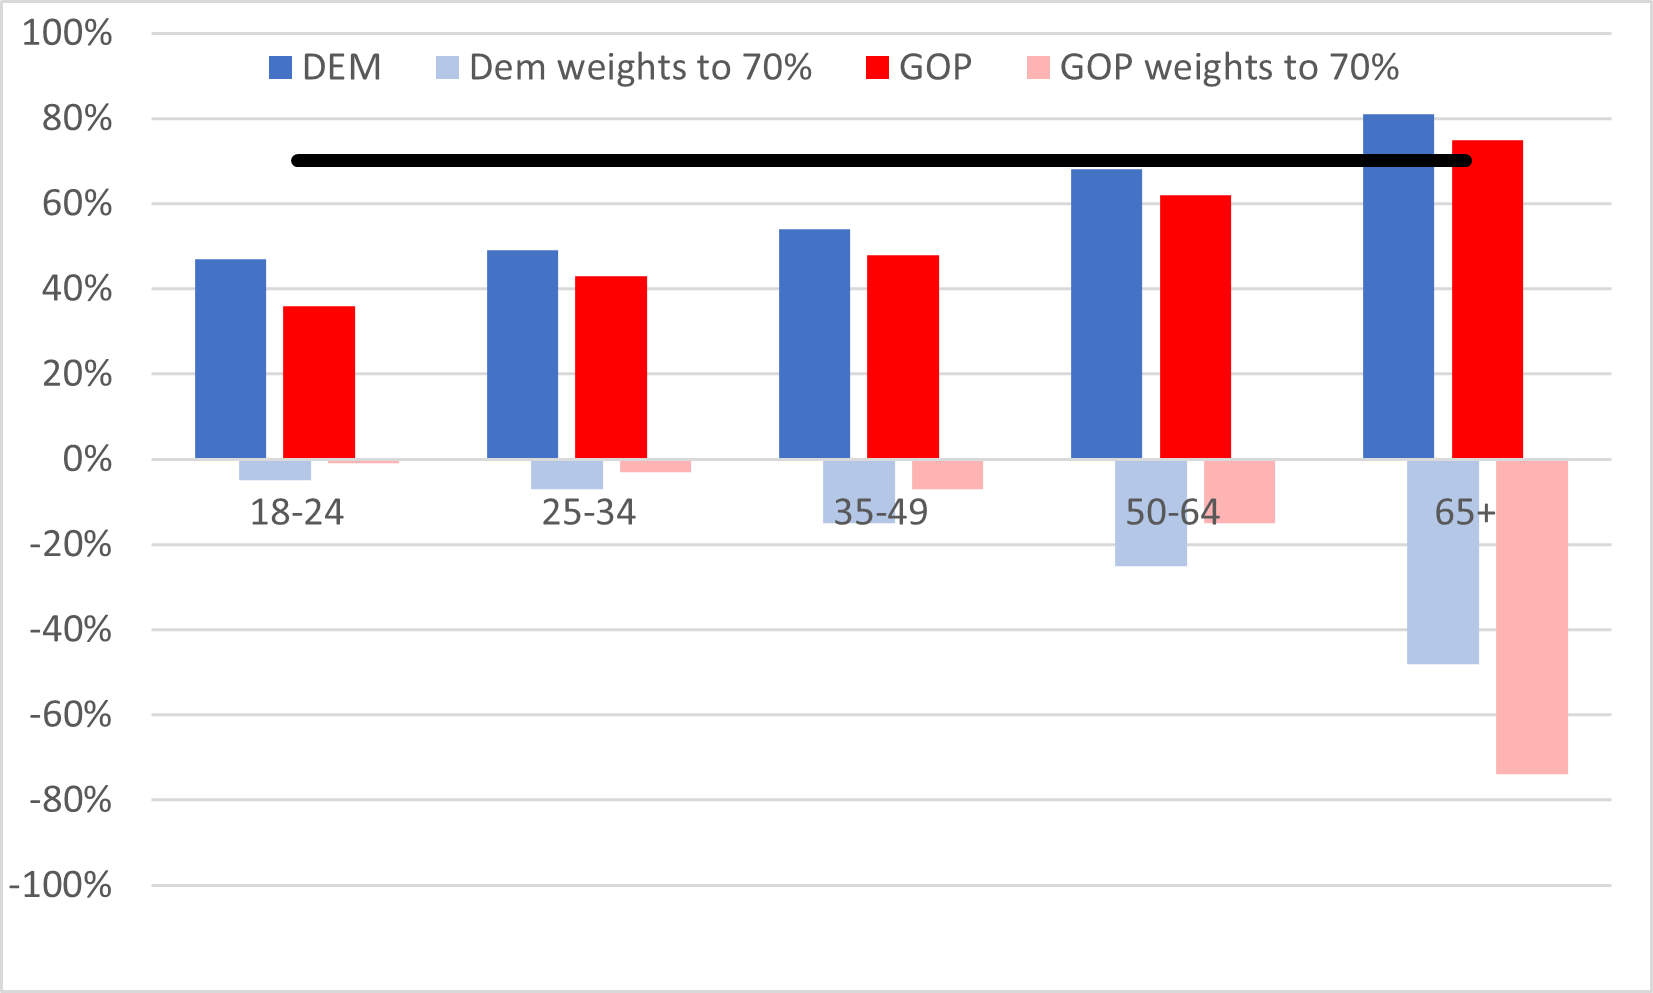
There’s nothing particularly weird going on here – just normal differences between groups.
What’s the point of this?
First off, Simpson’s Paradox shows up all the time in real life.
It comes from trying to go from subgroup averages to aggregate averages (or vice-versa), and then noticing that you cannot make logical comparisons because the subgroups do not have the same proportions/distributions so you cannot simply just average the averages, as it were, but need to do weighted averages.
I will link my prior Simpson’s Paradox posts at the bottom.
It comes up all the time in death statistics, because overall death counts come from a combination of what’s happening with rates and different age groups. I’m used to looking for Simpson’s Paradox situations.
Second, there will be various people next week (or over the next months) who will be displeased with electoral outcomes and use “statistical analysis” to “prove” shenanigans. Most of these people will know very little of legitimate statistical analysis, and they sure as hell don’t know Simpson’s Paradox.
They may see something like the percentages above and say… Democrat ballots are being undercounted! The Republicans are shenaniganning! The numbers aren’t right!
That sort of thing.
If you want to question, do the work
Though, alas, some people aren’t even bothering with that level of result, but just make stuff up, and see what will stick.
My point is just to point out that you may see something that looks like simple averages, and may see what looks like convincing argumentation that shenanigans may be afoot.
But it may just be Simpson’s Paradox (or a similar common way combination of numbers can get tricky if you’re not careful).
I think it’s okay to question the numbers, but you actually have to do the work and not be this meme:

Sometimes I dig into numbers and there’s no there there, and that’s that.
Sometimes there is some interesting pattern and something that should be investigated further.
Sometimes it’s a screwed-up model and then we can contact the people responsible and then it gets fixed. Huzzah!
So yes, sometimes shenanigans are afoot, but many times, people just don’t know the data or how to interpret it.
Prior Simpson’s Paradox content
Covid Data Follies – Vaccination Relative Risk and Simpson’s Paradox
Dec 2021: Accompanying blog post — Covid Data Follies – Vaccination Relative Risk and Simpson’s Paradox
August 2021: COVID and Simpson’s Paradox: Why So Many Vaccinated People are Among the Current Wave of Hospitalizations
Nov 2018: Geeking Out: On Life Expectancy and Conditional Expectation
May 2018: Mornings with Meep: Happy Mothers Day!
Sept 2000: Sexing your Meep or A little foray into Bayesian inference
Related Posts
Judgment in Moscow by Vladimir Bukovsky: Now Released!
Kentucky: Flurry of Anti-Union Legislation as Republicans Take Control
What a Week: Meep, Music, and Mulling
