Pension Quicktakes: How About that Stock Market? And Red Light Cameras?
by meep
How about it, indeed?
I just took these snapshots… and in a couple hours, I’m sure it will have moved more.

Of course, that’s only 5 days. Pensions have a longer horizon, don’t they?

5 years, ahhh… more like it.
But hey, let’s do the one year thing:
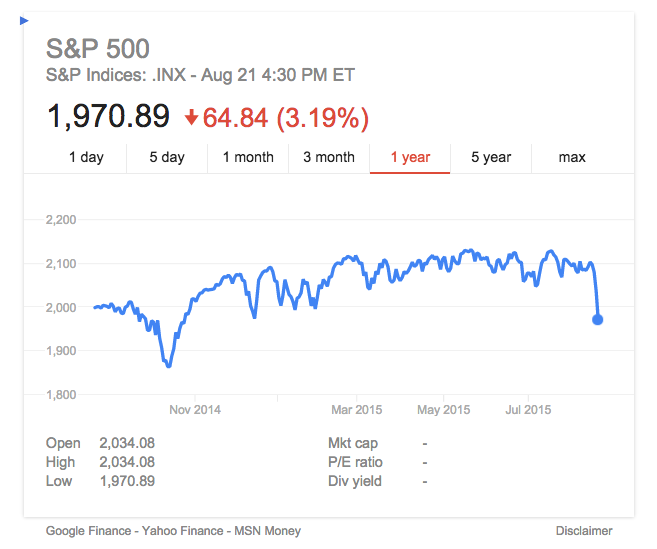
Ah, wiped out.
A PERSONAL REACTION: MEH
A few people are losing their heads at the Actuarial Outpost, which led me to state:
This is why I look [at my retirement accounts] about once a year.
I really do. I look on April 15. I won’t be looking at it now, because there’s no good reason for me to. I won’t need that money for 30+ more years.
That’s because I really am a long term investor.
I do try to keep liquid for my immediate needs, but I am not the kind who taps her retirement accounts on a regular basis. Yes, it’s a resource if I really, really need it, but “markets are down” is not such a situation.
Indeed, it’s the worst possible time to tap a retirement account: buy high, sell low, get hit with the tax penalty.
HOW LONG-TERM ARE PENSION PLAN INVESTMENTS, REALLY?
In my recent post on public pension plan returns for the past year, at best most were mediocre, and the ones that looked “good” seemed to look good due to reporting timing.
I meant to include this report for New York, but it was not out yet:
The New York State Common Retirement Fund’s (Fund) overall return in the first quarter of the state fiscal year 2015-2016 was 0.52 percent for the three-month period ending June 30, 2015, with an estimated value of $182.5 billion, according to New York State Comptroller Thomas P. DiNapoli.
“The first quarter presented a challenging investment climate,” DiNapoli said. “Nevertheless, New York’s pension fund remains strong and well-positioned for the future with a smart, long-term investment strategy.”The Fund’s estimated value reflects benefits paid out during the quarter. The Fund’s audited value was $184.5 billion as of the end of the state fiscal year on March 31, 2015.
As of June 30, 2015, the Fund had approximately 38.5 percent of its assets invested in publicly traded domestic equities and 15.0 percent in international public equities. The remaining Fund assets by allocation are invested in cash (1.5 percent), Treasury Inflation Protected Securities (TIPS) (4.8 percent), bonds and mortgages (21.7 percent), private equity (7.5 percent), real estate (6.4 percent), absolute return strategies (3.6 percent) and opportunistic alternatives and real assets (1.0 percent).
DiNapoli initiated quarterly performance reporting by the Fund in 2009 as part of his on-going efforts to increase accountability and transparency.
If he thought the first quarter was challenging….
But I expect we’re going to hear a lot more “we’re long-term investors!” nattering as more reports come out.
I wouldn’t be surprised if they say their alternative assets are doing well… because it’s pretty much impossible for outsiders to check on that. If they claim to have done much better in common stock than we see in the broader market, we know something is up. But private equity? Harder nut to crack.
But back to my question: how long term are public pensions in terms of investment horizon?
You may think that they have to be even longer than me…. except I am not tapping my funds for decades, and there are people receiving money now from the pensions.
Lots of money.
WHEN IS THIS A PROBLEM?
I am not going to do math in this post — I will do this later. But one of the worst problems for a set up like this is when there’s a free cash flow crunch.
You can end up with an asset death spiral.
We’ve often heard it crowed that investments cover public pension outflows more than contributions do (this is silly, but I don’t want to get into financial philosophy right now.)
But what happens when the investments have negative returns?
If the free cash flows are too low, you end up having to sell while asset values are down.
What are the cash flows involved?
- Some assets mature (like bonds or private equity being realized) and turn into cash
- Bonds and preferred stocks can spit out cash flows before maturity (but interest rates, and thus coupons, have been very low)
- New cash flows in, in the form of contribution
- Cash coming from the sale of Pension Obligation Bonds (PTUI!)
- Pension benefit payments going out
When those cash inflows are too low to cover the cash going out, then assets have to be sold to cover the payments.
When the market was going up, this was not much of a problem.
It is a problem when markets go down.
A lot of time there is an overreaction when stocks are going down. You don’t want to sell during a panic. But sometimes, you have little choice.
Then you sell when things are down, you realize that loss, and you miss the opportunity for recovery. Because the pensions have to keep getting paid. So more assets have to get sold… this is how an asset death spiral begins.
Especially if your funded ratio was very low to begin with. I think many will find that vaunted 80% threshold out of reach and try to adjust that threshold downward.
SQUIRREL! I MEAN, MORE MONEY!
This is supposed to be a quicktakes post, so let’s look at something completely different: source of money for Chicago!!
Chicago collected $285 million in red-light camera tickets from May 2011 through July 2015, according to the Chicago Sun-Times, which received these data from a Freedom of Information Act request.
Each ticket costs $100.
Over that span of 1,552 days, the city hit drivers with 2.2 million tickets.
That boils down to a rate of more than 1,418 tickets per day worth $183,570, or about 59 tickets per hour worth $7,649.
Apart from revenue, what did the city’s nearly 300 red-light cameras do for Chicago?
There’s no evidence proving that red-light cameras have made Chicago’s streets any safer. In fact, a Chicago Tribune investigation proved the city’s red-light program provided few safety benefits at all. Chicago’s red-light cameras caused a “22 percent increase in rear-end crashes that caused injuries” according to the Tribune’s research, which also debunked Mayor Rahm Emanuel’s claim that the program is responsible for a “47 percent reduction in dangerous right-angle, or ‘T-bone,’ crashes.”
Go to the piece to learn about the scandal involving the red light camera company, which is not relevant to this story.
Let’s put some context back into the story: how does $183,570/day in ticket take compare to Chicago’s cash burn rate?
(that’s assuming everybody pays their tickets, and they don’t — sometimes they beat the rap, and sometimes they just don’t pay. So then Chicago has to pay for collections….)
Going back to a Chicago budget-wrangling post:

$4.8 billion annual budget = $13.2 million per day.
So that red light camera take covers 1.4% of the budget….. just for the Chicago Public Schools. Ha, that’s not the entire city budget. The city budget seems to be about $9 billion, and I don’t think that includes the schools.
And, again, they’re probably not getting 100% take on the program. They have to pay the red light camera company something.
So, enjoy causing car crashes to cover less than a percent of the city budget. Way yo go!
Related Posts
Tales of Pension Fraud: Hidden Deaths and Elder Abuse
Cook County Soda Tax: The Current Mess
Cook County Soda Tax: Look Who's Come to Save the Day!
