Geeking Out: How Dependable are Lottery Revenues? And Government Data Sources?
by meep
This is following some thoughts I had from Thursday’s New Jersey stupid idea post.
So I went searching for a data set, and here is a page that has info on lotteries. I had to do some searching around, but I got the lottery data for New Jersey, which goes back to 1992. Actually, I couldn’t get all the data through there, but that’s a different tale for farther down in the post.
The spreadsheet I made that did all the graphs below is here. It has macros in it — what the macros are needed for is to update graph titles and axes when you choose different states to graph. The spreadsheet will still work without the macros; it’s just the graphs will be mislabeled and the axes may need to be adjusted manually.
NEW JERSEY LOTTERY PROCEEDS
Here is my graph of revenues, and “profits” once prizes and expenses are removed (just for New Jersey). Sorry, this one isn’t labeled — $ are in millions, so the graph ends up a little under $850 million in 2015.

Hmmm. Not enough sizzle.
I know — let’s put on a linear trend!

Ooooh, ever upward!
But hold on — looks like the proceeds actually may have peaked out in 2012, and are coming down.
Let me slap a few extra trends on there:

So I have a question: when they valued the lottery as an “asset” for the pension plan, did they assume that it would always keep growing? Linearly? Exponentially (same as constant % per year)?
I’m going to guess they didn’t fit a cubic.
There are a few other projections that may also make sense, assuming saturation of the lottery demand — cubic doesn’t really work, but something like a logistic function would probably be good.
(The reason I used exponential and cubic was because they’re built into Excel. I’m not going to do a huge amount of work here.)
NATIONAL TRENDS
Here’s the deal — I grabbed more than just New Jersey data.
Let’s look at the proceeds for the entire United States over time.

That’s a stronger positive trend. I calculated the CAGR (compound annual growth rate), and it was 4.5% per year for the period of 1992 – 2015.
New Jersey had a CAGR of 1.7%… that’s pretty weak.
But hey, let’s check it out — I’ve got all the states in the file. Some of them didn’t have lotteries at all, and some of them didn’t have lotteries in 1992, so I will restrict it to states that had lotteries the entire period. I highlighted a few neighboring states to New Jersey.

WOOOOT! NEW YORK! Let’s check out New York proceeds:

But also note Delaware. Much faster growth, but it is growing from a smaller base. And if we look at the graph:

If I were Delaware, I wouldn’t be assuming linear growth.
BUT WAIT, THERE’S MORE
Above, I graphed the proceeds available to state coffers after all the prizes and admin expenses are taken out.
But I have the prize and admin amounts, as well as initial income.
Here’s the graph for New Jersey:

Squint at 2012 and 2013… the proceeds, admin, and prizes doesn’t add up to income. HMMM.
Let’s look at the entire U.S.:

Huh?! What the hell happened from 2006 – 2008?
DIGGING IN THE DATA
So I basically looked at the data for all of the states. I found five weird states, so here we go.
Three weird states are feeding the 2006-2008 bump up:
Delaware:

South Dakota:

West Virginia:

Now the bump up is just in the income part, not really the proceeds. We saw that in the Delaware proceeds graph above, but the same goes for SD and WV:


But there are two other “weird” states:
Oregon:

Rhode Island:
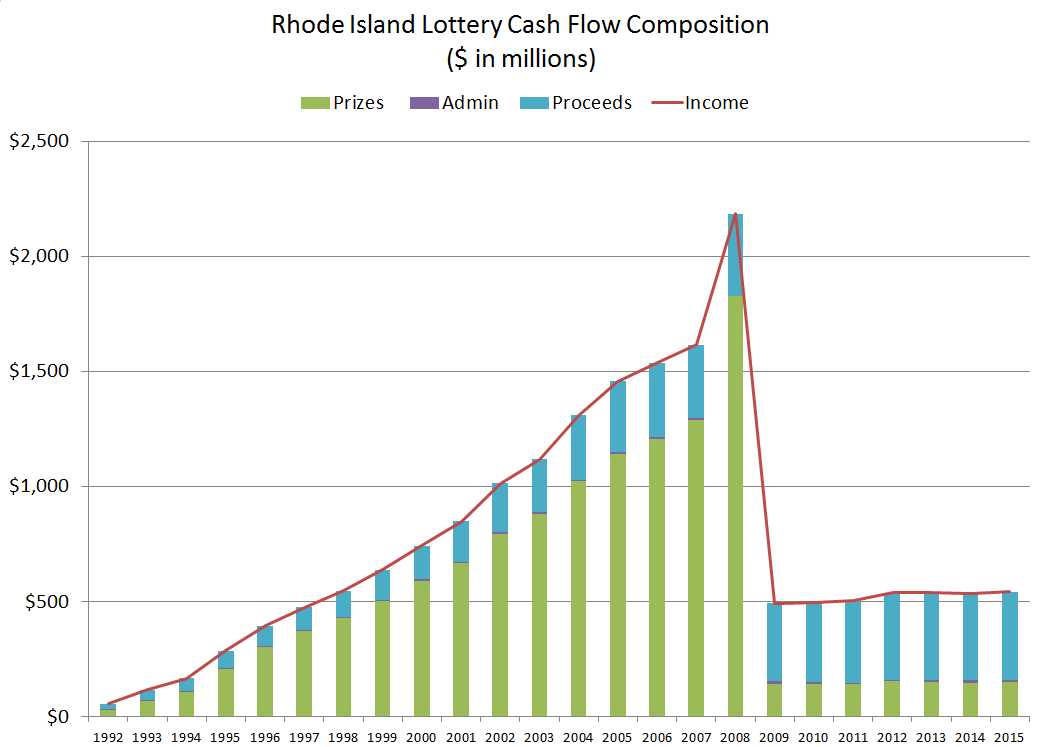
But again, if you look at the proceeds graphs:

YOWZA that’s volatile. What are they doing?

A little more stable.
ALWAYS CHECK THE NUMBERS
I am not going to bother to try to figure out what happened there, but I can think of several explanations, none of them being nefarious.
Note that the weird cash flow thing seems unconnected to how much the states actually collect in lottery proceeds. I think the proceeds numbers are probably fairly reliable.
The issue may be the prize numbers, which are really inflated those years. Perhaps there was double counting that did not get fixed on those items. If I were an auditor, I would be trying to get the data straight from the states (as opposed to the U.S. Census Bureau, which is the source of my data), and trying to see if the numbers match. What may have happened was that the prize amounts there may be subtotals from other states.
Anyway, I generally am not generating data, or collecting it, but rather taking other people’s data sets and analyzing them. I do not necessarily audit the numbers (I don’t even have the power to, in some cases), but I do often turn up data problems, because I will calculate and graph things multiple ways. I often find disparities in that way.
I could say I am being guided by Actuarial Standard of Practice 23: Data Quality, which I definitely use on actuarial work (except I rarely do any actuarial work). But I’ve always been an “assume errors, so you need to check” kind of person.
In any case, I wonder what assumptions New Jersey used in valuing their lottery proceeds. I especially wonder what their growth assumption was.
Related Posts
COVID Data Follies: Vaccination Rates, Relative Risk, and Simpson's Paradox
Memory Monday: Wildfires of 1918 with some Graphs on California Wildfires
Happy Bobby Bonilla Day! In Praise of Valuable Annuities
