Mortality Monday: Suicide -- Rates
by meep
Now we come to the nub — last week I showed absolute numbers of suicides in the U.S. in 2014, but those numbers show a distortionary effect. When I slice by sex, at least the underlying populations are about the same size (except for old folks). But when slicing for age or race/ethnicity, there are very different group sizes.
For the following, I will be using other people’s graphs, because the proper way to think about trends is not absolute numbers, but rates.
MISLEADING GRAPHS
To begin with, I have a misleading graph which was the original reason I started a post 3 years ago. It’s from this Washington Post piece following Robin Williams’s death. Like my own graphs from last week, it’s simply a count of suicides by various demographic groups.

This misleading here is very simple: there are a hell of a lot more white men than men of any other race/ethnicity, and, more to the point, they’ve got a different, older age profile compared to other racial/ethnic groupings.
This doesn’t really make me angry, but it isn’t really helpful in telling us how much more likely white men are to kill themselves, except perhaps in contrast to white women. Maybe it’s a huge problem for black men, too, but you can’t tell from those numbers.
Here’s a different misleading graph from the Suicide Prevention Resource Center, which makes me extremely angry:

Perhaps you don’t see what is concerning. The stats themselves are not incorrect.
Let me pull something else from that page, and perhaps you can start to see what the problem is:

Look at the age 65+ bucket. No suicide in the top 10 — pretty good, right?
I will pull a different graph from a different part of the site: Racial/ethnic disparities in suicide rates

Maybe you can see it now. I’m not showing you this because of the Native American suicide rate pattern (though that is very interesting in and of itself). It’s because of the green bars. Put that in the back of your mind while I go to the best source on this matter: the National Center for Health Statistics from the CDC.
SUICIDE TRENDS BY SEX
I’m drawing on a study looking at suicide rates in the U.S. from 1999-2014. A similar study on the same data are here.
Let’s go through the graphs in order, so that we can see what’s going on.
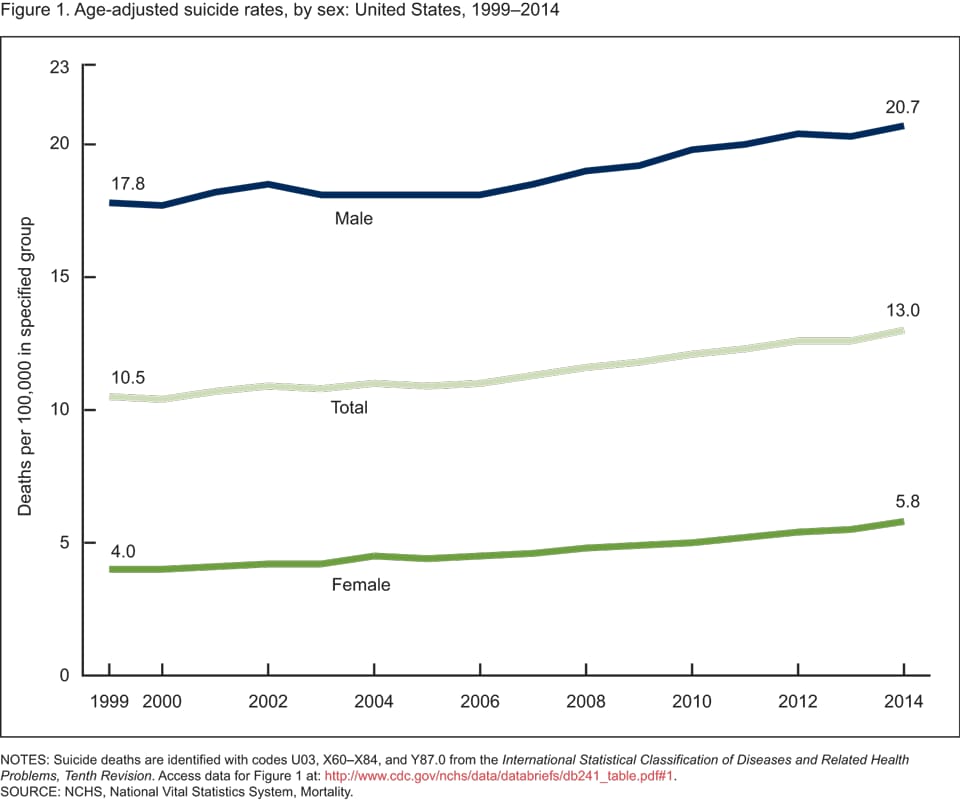
One can see how misleading overall population stats can be, given that male suicide rates are over 3x that of female rates, almost 4x, even.
But great news! The gender gap is narrowing!
From 1999 through 2014, the percent increase in the age-adjusted suicide rate was greater for females (45% increase) than males (16% increase), resulting in a narrowing of the gender gap in suicide rates (as measured by rate ratios). The ratio of male to female suicide rates was lower in 2014 (3.6) than in 1999 (4.5).
Obviously, that’s not great news. But let’s see where these increases may be coming from by looking at an age breakout.
FEMALE SUICIDE TRENDS BY AGE
The next graph directly compares the 1999 suicide rates against the 2014 suicide rates by age, for females.
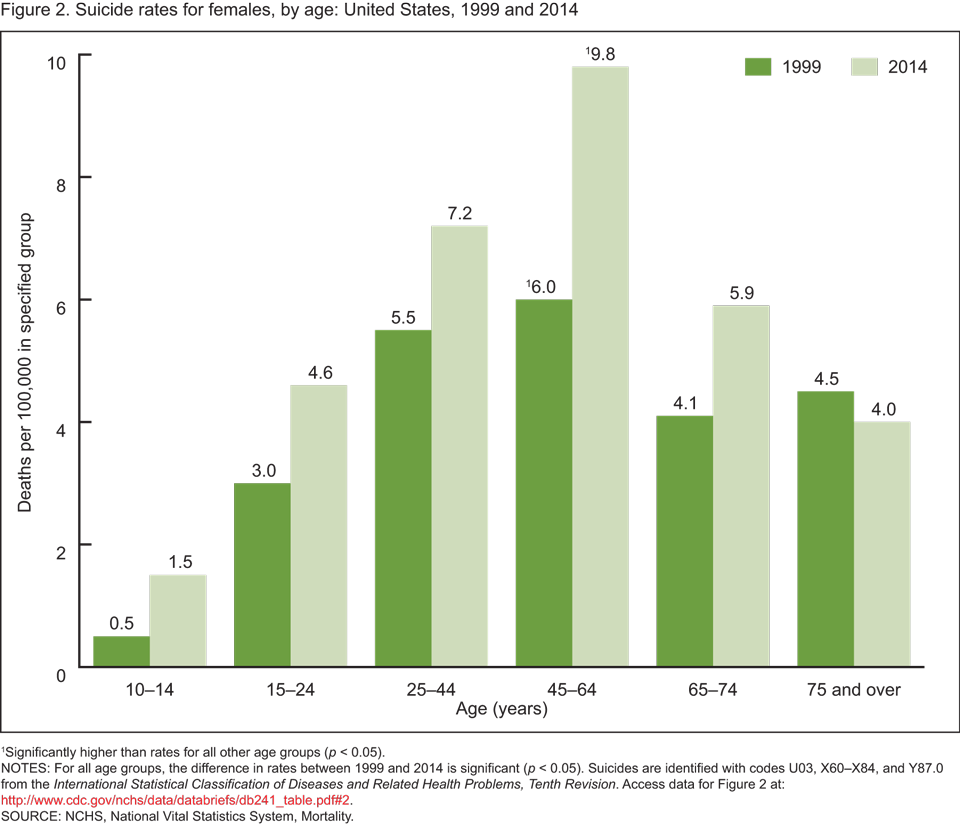
Now that’s an interesting change. The increase from females is coming primarily from middle-aged women, age 45-64, which had already been the peak ages for suicide in women. What I find interesting is the decrease for elderly women, age 75+.
Here is the CDC’s summary text:
Suicide rates for females were higher in 2014 than in 1999 for all age groups under 75 years.
Suicide rates for females were highest for those aged 45–64 in both 1999 (6.0 per 100,000) and 2014 (9.8) (Figure 2). This age group also had the second-largest percent increase (63%) since 1999.
Although based on a small number of suicides compared with other age groups (150 in 2014), the suicide rate for females aged 10–14 had the largest percent increase (200%) during the time period, tripling from 0.5 per 100,000 in 1999 to 1.5 in 2014.
Percent increases in suicide rates since 1999 for females aged 15–24, 25–44, and 65–74 ranged between 31% and 53%.
In contrast to other age groups, the suicide rate for women aged 75 and over decreased by 11% from 1999
through 2014, declining from 4.5 to 4.0 per 100,000.
It’s relatively easy for a very small number to increase by huge percentages (i.e., the suicide rate for girls age 10-14), but that 63% increase for middle-aged women is really concerning.
Let’s see what the pattern for men is.
SUICIDE TRENDS FOR MALES BY AGE
Here we go:
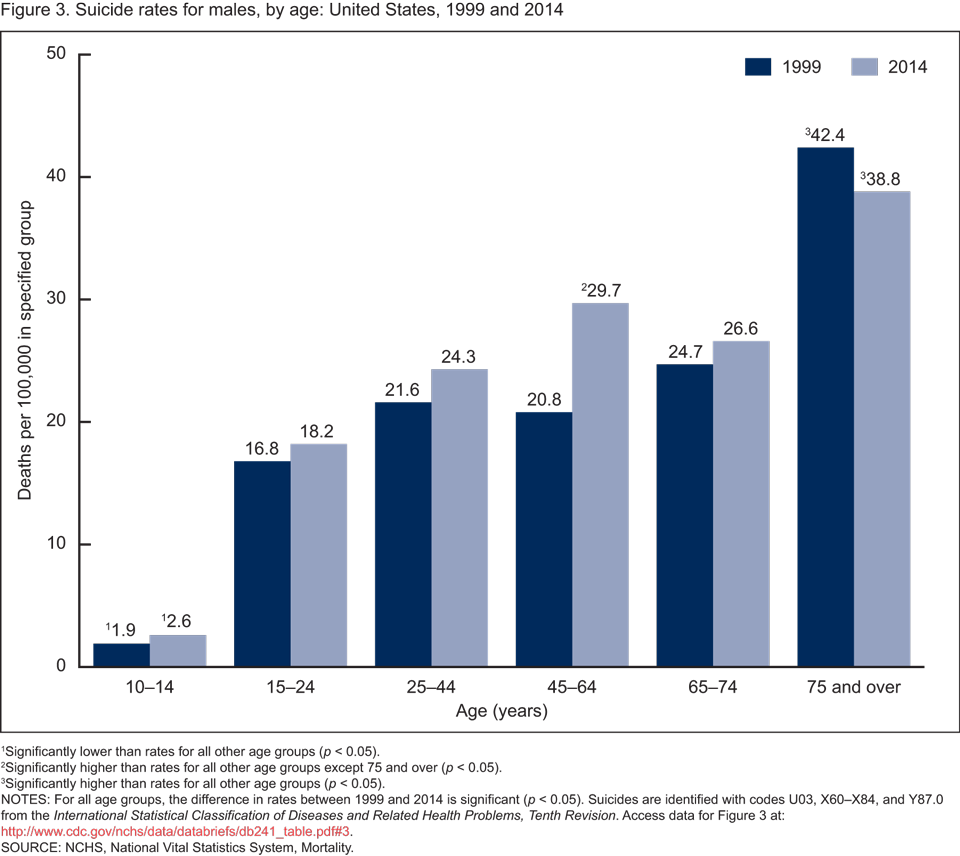
Now, that doesn’t quite comport with the age-based suicide rate trend we saw above, now did it? Where we were shown that middle-aged people had the highest suicide rate?
Let’s give the CDC time for its summary text:
Suicide rates for males were higher in 2014 than in 1999 for all age groups under 75 years.
In both 1999 and 2014, suicide rates were highest among men aged 75 and over (Figure 3). In contrast to other age groups, the suicide rate for this demographic group decreased by 8%, from 42.4 per 100,000 in 1999 to 38.8 in 2014.
Men aged 45–64 had the second-highest suicide rate for males in 2014 and the largest percent increase (43%) in rates, increasing from 20.8 in 1999 to 29.7 in 2014.
While males aged 10–14 had the lowest suicide rate of all age groups, this group experienced the second-largest percent increase (37%) from 1999 through 2014 (from 1.9 to 2.6).
And now back to what got me angry earlier.
SUICIDES AMONG ELDERLY MEN IS A SERIOUS PROBLEM
The highest suicide rates are for elderly men. It has been this way for a long time. But that is ignored – and that is what got me angry above.
It was glossed over in the graphs at the top by combining men with women, as well as grouping the 65-74 people with the 75+ crowd… or just not including the 75+ grouping at all. You could start to see the issue with the Native American vs. Overall graph — the graph starts going up for age 70-74 and 75-79… and then it just drops. Well, for old men, the suicide rate keeps climbing with age.
From 2013: Suicide Rates Are High Among the Elderly
…. Why are suicide rates so high among seniors? We know that while older people make fewer suicide attempts than the young, they are far more likely to die from them, in part because they rely primarily on guns. “Younger people have more physical resilience and use less lethal means,” said Dr. Yeates Conwell, a psychiatrist at the University of Rochester Medical Center who has studied late-life suicide.
Moreover, depression is behind a majority of suicide attempts, and “a lot of older people have problems asking for help,” Mr. Arbore said. Depression can involve different symptoms in older patients, and “men are good at masking it, because we’ve been conditioned to believe it’s not O.K. to express emotional pain.”
Beyond mental illness, researchers have identified a cluster of other risk factors in late-life suicide, including physical illness and pain, the inability to function in daily life, fear of becoming a burden and social disconnection. “Things that remove older people from their social groups — bereavement, retirement, isolation — leave them vulnerable,” Dr. Conwell said.
…..
“The proportion of older people who take their lives without a diagnosable mental illness is very, very small,” Dr. Conwell said. Because elderly suicide is generally a result of multiple factors — physical illness and depression and a recent loss, say — “if you change one of those parameters, it may tip the balance in favor of finding solutions that help you want to live.”
At the Center for Elderly Suicide Prevention, staff and volunteers handle 3,000 calls a month to the “friendship line” (a name deemed more acceptable to seniors than “suicide hotline”). They also place 3,500 outgoing calls to people considered isolated or otherwise at risk.
“We believe connections are what bind us to life,” Mr. Arbore said. “Just having the opportunity to talk might shift their view of the end, temporarily. It might not have to happen today.”
Such opportunities to talk, in ways tailored to older adults, should be more widely available than they are. (One resource is the Veterans Affairs Department’s Veterans Crisis Line.) Instead, the task of trying to recognize elderly depression and encourage treatment falls largely to primary care physicians and, of course, to family members, who should always take suicidal talk seriously. When a depressed and hopeless relative commits suicide, the family must cope not only with grief but often with guilt and unanswered questions.
I mentioned Broken Heart Syndrome earlier this year, when people are more likely to die when a spouse dies. I didn’t mention that often this is a one-way thing — men are much much more likely to die when a spouse dies, than vice versa. Some of this may be from just a simple disparity in male v. female mortality rates, but I think loneliness is a huge part.
But again, I am not thinking so much as to why the suicide rate keeps increasing. It does increase.
What gets me angry is not that the rate increases, but that it doesn’t seem people much care. “They’re gonna die anyway”. Well, we’re all going to die anyway. “They don’t have much to live for” And why is that, exactly? Maybe they could be enjoying life, if people simply helped them. You know, call once in a while. At least.
I wouldn’t be surprised if the suicide rate for the elderly gets a lot worse. There are a lot of childless Boomers, or Boomers with only one kid. And some had those kids rather old, and their own kids don’t have kids til rather old. Not many grandkids to visit.
But I believe one of the biggest reasons people don’t take senior suicide all that seriously is because it’s not even close to a top cause of death for the oldest people. Look at that top-ten table — it doesn’t even rank for the 65+ crowd. Heck, septicemia kills more old folks than suicide.
FOCUS ON CHILD SUICIDE
So much is concentrated on preventing child suicide, even though it’s extremely unlikely, because so few kids die, period. It’s a top cause of death for children — partly because all the other things that used to kill children either don’t anymore, or have been greatly reduced.
An example: Suicide Kills More Middle School Students Than Car Crashes
The suicide rate among U.S. middle school students doubled from 2007 to 2014, surpassing for the first time the incidence of youngsters aged 10 to 14 who died in car crashes, federal researchers found.
The steady seven-year rise in middle school suicides, from an annual rate of 0.9 to 2.1 per 100,000, came as traffic deaths among the same age group declined to 1.9 per 100,000, according to the Centers for Disease Control and Prevention in Atlanta.
The motor vehicle mortality rate reported for 2014, the latest year for which such data was available, showed a 60 percent decline from 1999, when the government began tracking such figures.
Yes, the suicide rate has increased — more than doubled, even. (In the top ten causes graphs above, btw, accidental injuries still tops, because that includes other accidents than just traffic deaths)
But this is still much lower than suicide of elderly people. Or middle-aged people. Or, heck, teenagers.
To quote the piece again:
In aggregate numbers, 425 young people 10 to 14 years of age took their own lives in 2014, compared with 384 who perished in automobile accidents that year, according to the CDC.
Those figures contrasted sharply with figures from 1999, when the rate of middle school students killed in car crashes was four times higher than the rate among those who died from suicide that year.
“Any rise (in youth suicides) should be of concern, there’s no doubt,” Mark Kaplan, a professor of social welfare at the University of California, Los Angeles, said in a phone interview, commenting on the findings.
Part of the problem is the very small numbers involved. I can see why Prof. Kaplan is hesitant — the youth suicide rate is 0.0021% in 2014 versus 0.0009% in 1999 — these are both extremely small and some changes can come from small randomness. It’s not a good trend, to be sure. But it’s much much lower than any age group other than those under age 10.
RACE/ETHNICITY TRENDS
I’m using this study for this part. Thanks to the researchers for making most of the graphs for me, but I still will end up making one to highlight details I want to highlight.
First, the base graphs:
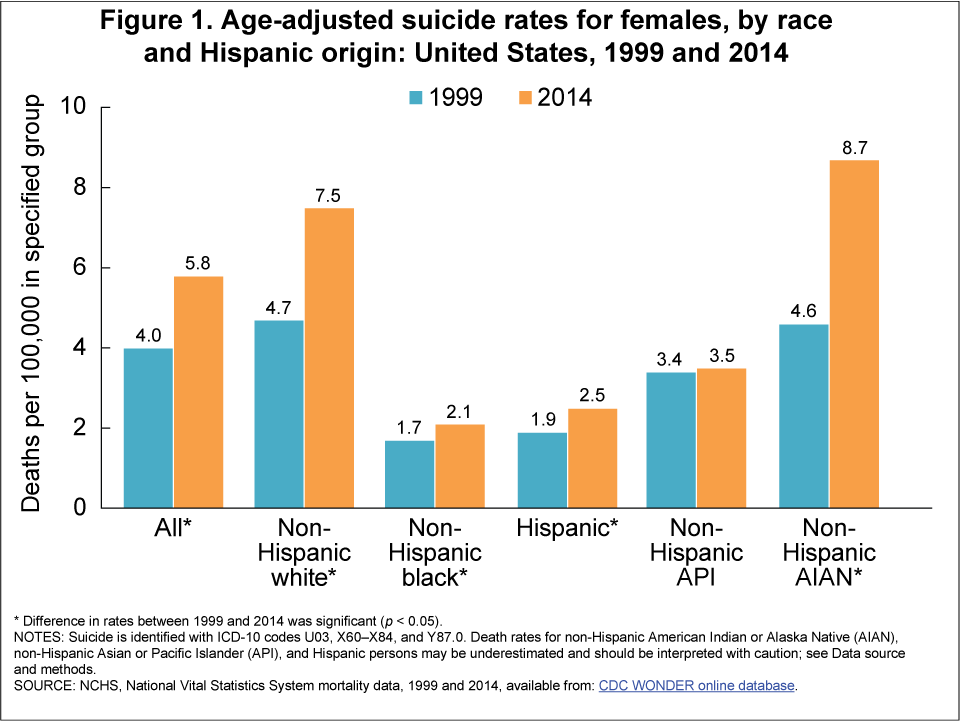
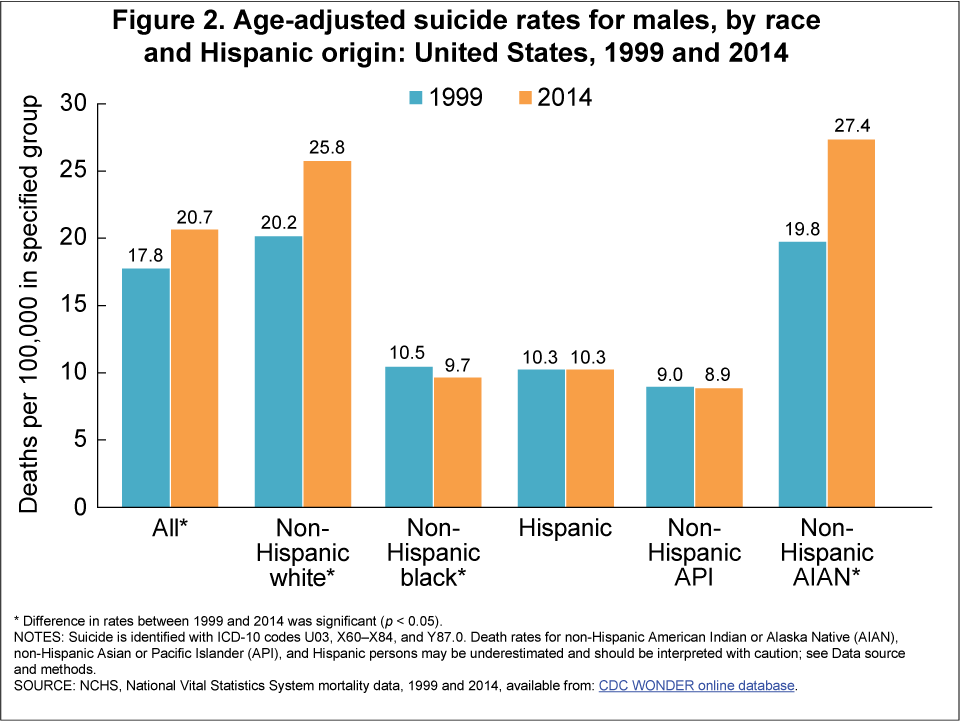
To decipher the abbreviations above:
API = Asian or Pacific Islander
AIAN = American Indian or Alaskan Native
The CDC has a warning regarding some of these ethnic/racial groups:
Deaths for all causes for non-Hispanic AIAN, non-Hispanic API, and Hispanic persons have been shown to be misclassified to other racial and ethnic groups, resulting in underreporting of these deaths by about 28%, 7%, and 5%, respectively (2,3). Despite this underestimation, these groups are included in this report so that all major Hispanic-origin and race groups are presented. Although the extent and direction of misclassification of suicide deaths is unknown, numbers and rates for these racial and ethnic groups are most likely underreported.
Note that this warning did not appear for earlier graphs. So the point is that we may not be able to rely on these data carved out this way.
This was something I noticed in my absolute numbers, for what it’s worth. Many of the death records had no race or ethnicity, even imputed. All the death records had a sex recorded. Thought that was interesting. I hope that doesn’t change in the name of not hurting anybody’s feelings.
Now, let’s focus in on two groups as a result: non-Hispanic white and non-Hispanic black.
I will have to make these graphs myself, but there’s a handy table at the bottom for me to use.
Let’s graph this a few ways. Let’s just do a snapshot of four groups: male NHW, female NHW, male NHB, and female NHB – rates in 2014.
To note: suicide rate for Non-Hispanic White males is higher than the other 3 groups, and tends to increase with age.
Suicide rates for Non-Hispanic Black females are very low. Note that I don’t even have data points for age 10-14 and 75+ — that’s because so few black females in those age ranges died by suicide. One couldn’t credibly compute a rate.
Now let’s do a 1999 -> 2014 comparison. I will graph White Men vs. White Women for this one, so you can see the changes. I marked a couple changes in particular.
The obviously large concerning trend is for white men, age 45 – 64.
Let’s compare white men versus black men.
Interestingly, younger black men – age 25 -44 – have the highest suicide rates for black males. And the suicide rates for older black men has been somewhat low and decreasing.
Finally, black men vs. white women.
The data labels are only on a few of the lines for white women — like with white men, the largest increase has been for ages 45-64.
I apologize for the crappiness of the graphs. I made these graphs in google docs, and they may not embed properly. If not, you can look at the spreadsheet and graphs directly at this link. Perhaps I could have done a bit better in Excel, but I’m laid up right now and google docs is the easiest for me to get at.
That’s it from me on suicide for a bit on Mortality Mondays. I may return to it, if something specific comes up, but I have more than enough to work with for homicides and drug overdoses for the next few weeks (not to mention, more suspicious deaths of Russians).
Related Posts
STUMP Classics: The Many Deaths of Sean Bean
Movember Fundraising: Do It For Stu!
Mortality Nuggets: NYT Misleads, COVID Deaths Down, and Car Crash Fatalities Up
