Geeking Out: Best Way to Graph Stock Market Indices
by meep
So, I was reading this piece on a supposed market Super Bubble, and what it means for pensions.
However, I found this chart misleading:
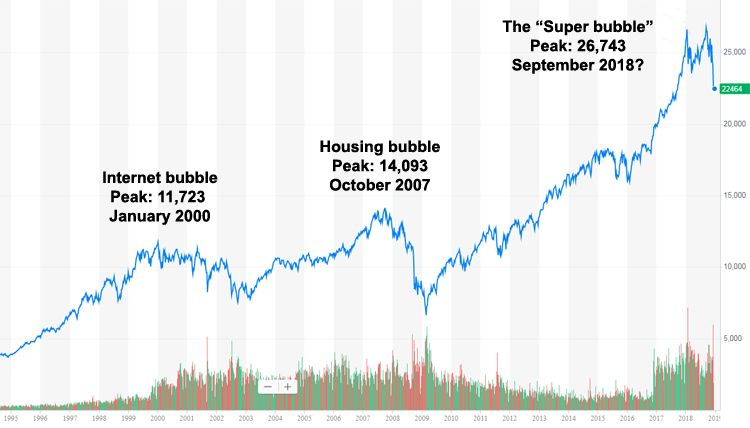
The problem is that a linear vertical scale for index amounts is irrelevant to any investors — the proper scale, if you want to emphasize returns, is a logarithmic scale. It helps capture similar percentage changes — at 10% decrease at a higher stock market level will look bigger than a 10% decrease at a lower level.
So, a 10% decrease of the DJIA at 5,000 would drop from 5,000 to 4,500 — 500 on the vertical scale.
A 10% decrease of the DJIA at 20,000 would drop from 20,000 to 18,000 — 2,000 on the vertical scale.
But both are the same effect on an investor in the market. A 10% drop.
So here’s a better graph of the same data:

So note: the vertical axes are doubling with each level… a drop of 50% is the exact same vertical distance… so you can see a generic slow slumping from 2000 to 2003, a precipitous drop at the end of 2009, and then yes, some current volatility.
Anyway, this is something I keep in mind when looking at financial graphs:
1. Am I being given the relevant data? (also, can I check the data directly)
2. Is it being presented appropriately, given the nature of the data? (here, it’s scale, but also whether the scale should include zero, what proportions, etc.)
I knew that the vertical scale was exaggerating recent movements (and, anyway, the next two trading days after Dec. 24 wiped out the Dec 24 drop).
There’s no need to be misleading re: investment returns for public pensions, for crying out loud… and besides, many use mid-year annual numbers because their fiscal years don’t start/end on Jan 1/Dec 31.
Related Posts
Memory Monday: Wildfires of 1918 with some Graphs on California Wildfires
Geeking Out: How Dependable are Lottery Revenues? And Government Data Sources?
What's the Income Percentile for the Obamas? Number-Checking
