Mortality with Meep: Some Mortality Trends in the Storyline Game
by meep
Howdy to any new readers coming via Storyline. For those who don’t know me, I’m meep, aka Mary Pat Campbell, and I’m a life actuary.
What’s an actuary you ask? We’re professionals who specialize in quantifying aspects of all sorts of risks. What’s a life actuary? That means I specialize in risks involving how long people live (on the flip side – how soon they might die). I have worked with life insurance, life annuities (providing payments until you die), and life reinsurance (a method of risk management for life insurance companies).
As a life actuary, I’ve been particularly interested in mortality trends from a variety of angles, trying to see how changes in medical treatment and societal behavior have led to some rather major shifts in mortality.
Back in July, I noticed the Storyline website, and in particular, noticed a quiz on mortality trends. I tweeted at the Storyline folks, and I sent them some stats and they made a second quiz on death.
Before proceeding, if you’ve not done that quiz, please go over there and do it now. It’s just five trends you need to quess, and we give you one point on the line. Just draw the rest of the line (we also give you a hint, and while it is pertinent, you may not know what to make of the hint.)
Below, I’m going to show you some of the results from the quiz — for each of the five items, we’ll see the actual trend, the average guess at the trends, and some light trails showing how people guessed individually.
Here we go!
CHILD MORTALITY
I’ve actually written about this trend before.
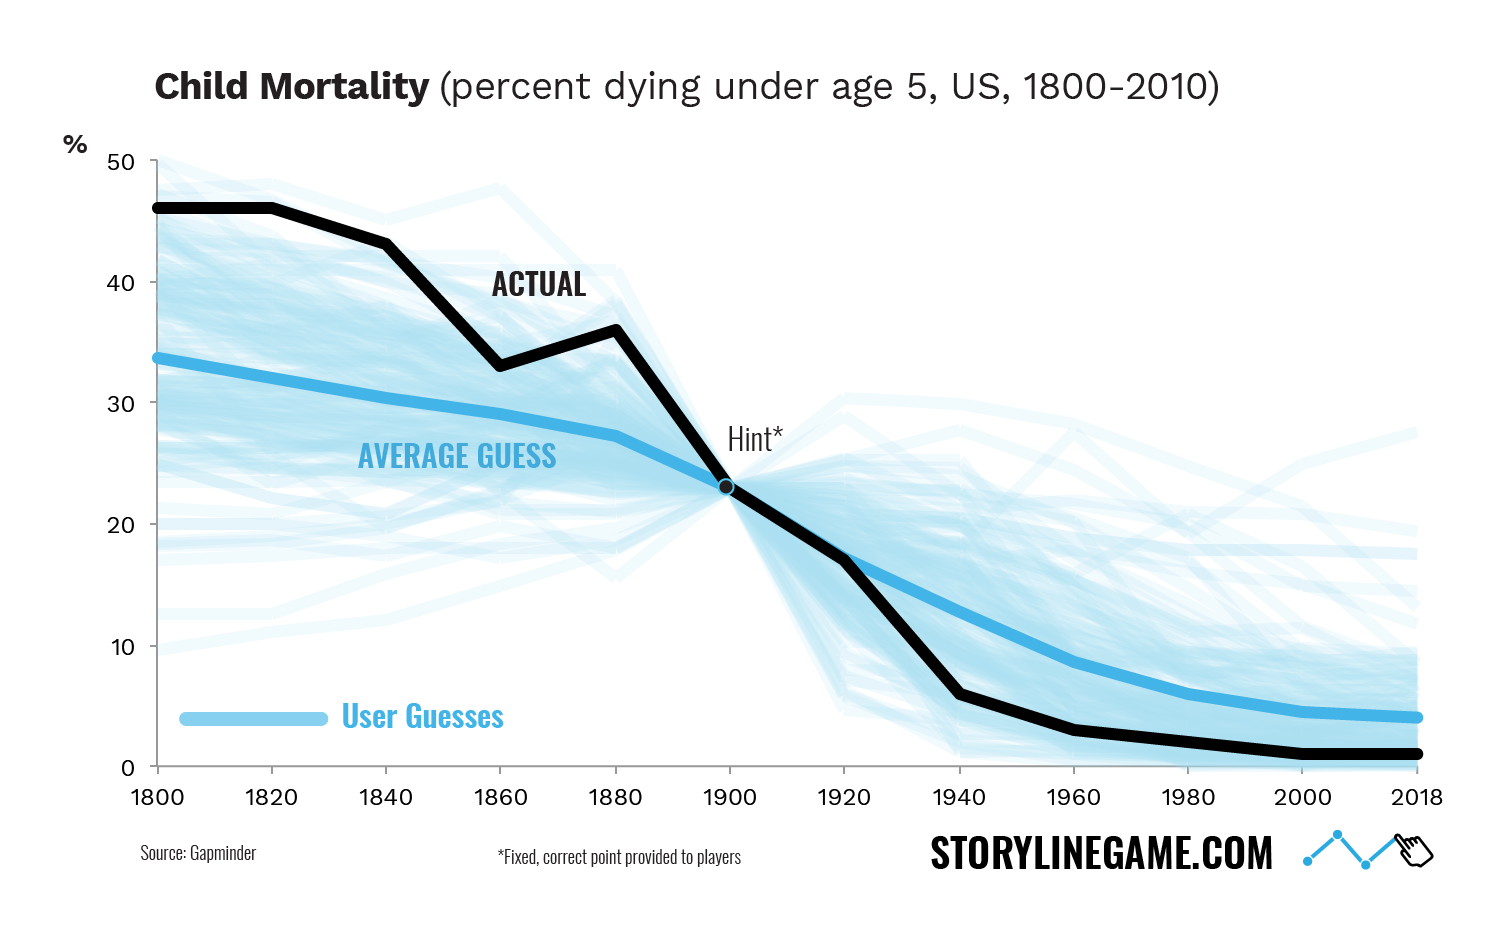
Many people don’t realize how high child mortality was, historically. Yes, it’s been estimated that almost half of the children born in the U.S. in 1800 didn’t survive to age 5. There was improvement in the 19th century, but one can see the spike at 1880, which was due to a diphtheria epidemic. Indeed, diphtheria was a big killer of children, even into the 20th century.
I find it interesting that guessers underestimated mortality for the 1800s and overestimated it for the 1900s and into the 2000s. I bet many people knew that mortality was going to be worse in earlier years (I wasn’t expecting anybody to know about the diphtheria outbreak), but didn’t understand just how bad it was. Many children in the 1800s died in their first year of life, especially soon after birth. In addition, infectious diseases felled many people, still a top cause of death in 1900.
What is very interesting to me is the huge drop off in child mortality from 1900 to 1940, with additional improvement to 1960. This follows the discovery of antibiotics and the development of vaccines for widespread child-killing diseases. No longer is diphtheria a top killer of children.
More recent improvements in child mortality have come from improved effectiveness of treatment in pediatric cancers, as well as improvement in automobile safety. You may not have realized how low child mortality is, because one may see news stories of child death. But the very rarity of a young child dying is why it makes the news.
CANCER DEATHS

In looking at the cancer deaths guesses versus reality, I assume many people were considering how cancer treatments have improved over the past century. This is definitely true, and for most types of cancers, survivorship rates have greatly improved. So the average guess was that cancer deaths were decreasing, albeit slowly.
However, that does not consider how many people get cancer to begin with, and why. One of the largest lifestyle drivers of cancer is smoking, and smoking rates peaked for American men in the early 1960s and peaked in the 1970s (at a lower peak) for American women. Of course, it often takes decades for cancer to develop from such causes. Cancer treatment didn’t get worse from 1900 to 1990, it was just that more people were getting cancer. Also consider: early in the 20th century, people were more likely to die of infectious disease or a heart attack before they could live long enough to even die from cancer.
Since 1990, cancer treatment has greatly improved. As noted in the hint for this graph: “1985 saw the first lab evidence that molecularly targeted therapy could reverse the malignant phenotype of tumor cells.” There are far more options for treatment, and even advanced cancer that had been a sure death sentence within a year are now treatable in that people may survive for years longer.
HEART DISEASE DEATHS

Heart disease is still a major killer in the U.S., but the death rates have greatly decreased. As with cancer deaths, a large driver of a worsening trend (here, in the 1940s and 1950s) was due to increased smoking, primarily among men. Unlike cancer, which may take decades before malignancies grow due to smoking, heart attacks can develop far earlier.
I can see that the average guesses were a slightly rising trend, though the light trails show a variety of trajectories. Perhaps, the average rising trend came from people considering the aging of American society, as heart disease incidence increases as people get older.
As the hint noted, statins were discovered in the 1970s, and that seems to be tied to a drop in heart disease incidence. In addition, reduced smoking has helped. On top of all these, treatment of people who already have heart disease has much improved.
Heart disease is still a top cause of death in the U.S., though it looks like cancer will likely surpass heart disease as a top killer, primarily because heart disease deaths have fallen so much faster than cancer rates. You gotta die of something sometime.
LIFE EXPECTANCY FOR 65-YEAR-OLD MEN
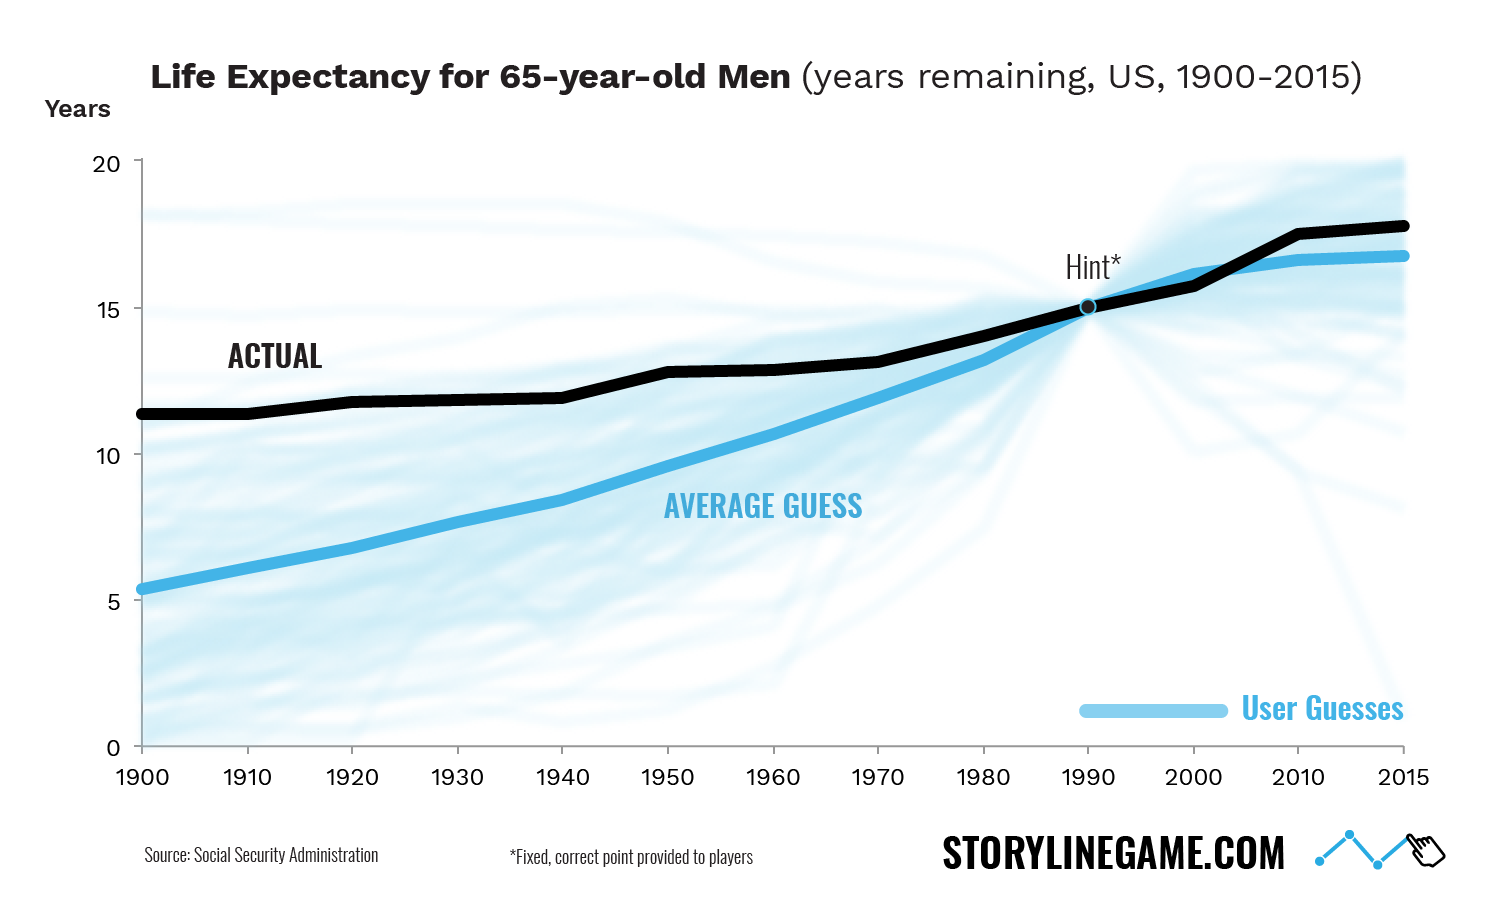
Life expectancy from age 65 and similarly high ages is important for retirement planning. To be able to plan for retirement, at the very least, you should know how long you may expect to live on average.
We gave the life expectancy for American men age 65 in 1990, which was about 15 years. That means, if you were a 65-year-old man in 1990, you would, on average, have expected to live another 15 years, to age 80.
The guesses for both pre-1990 and post-1990 amounts were less than the real numbers (which comes from the Social Security Administration).
The disparity between the guesses and the actual amount was greater for the early 20th century, which doesn’t surprise me. Many people have gotten then idea that, early in the 20th century, men would work to age 65, retire, and then drop dead soon after that. I believe some get this impression because life expectancy from birth was very low, many times less than 65 for the early 20th century.
Life expectancy was low because child mortality was high – as well, middle-aged people died more often in the first half of the 20th century. It turns out that if you managed to reach age 65, even in 1950, you still were likely to have many more years ahead of you.
One interesting item is that life expectancy for older people slowly increased, until about 1970. There were only 2 years improvement from 1900 to 1970. However, in the 45 years from 1970 to 2015, the life expectancy for men over age 65 increased 5 years. One driver may be Medicare, which started in the Nixon administration. At the same time, there were longevity improvements due to drops in smoking, as mentioned earlier.
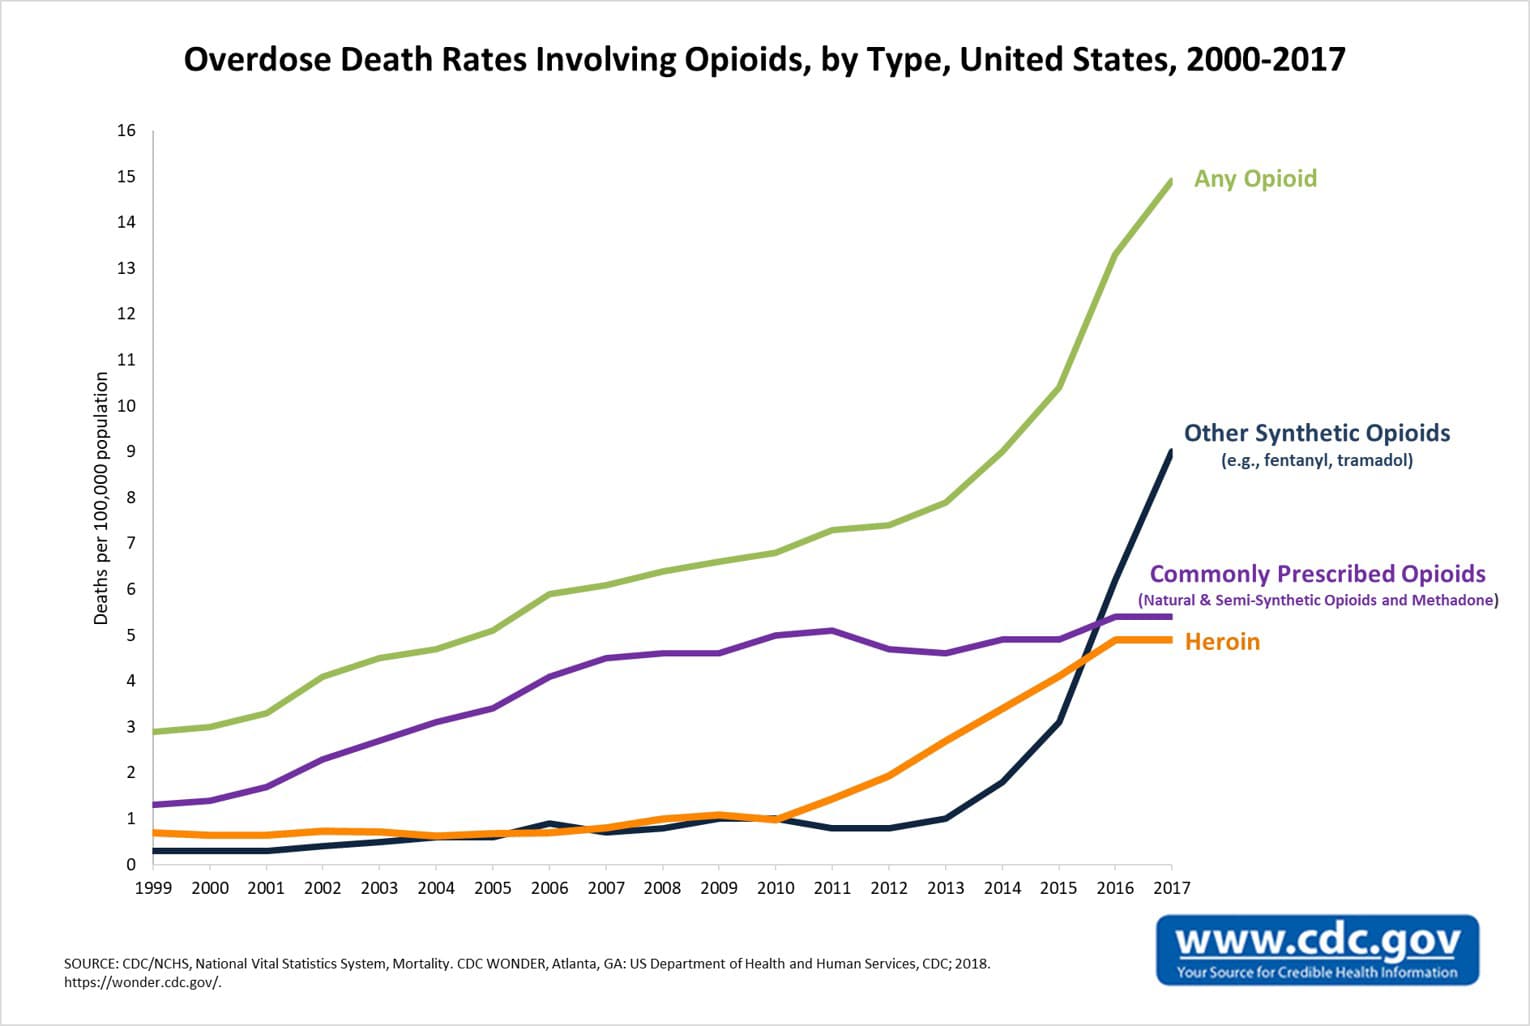
DRUG OVERDOSE DEATH RATE

Of all the mortality trends, this one is depressing. In general, we’ve seen deaths by various causes decrease, and some have greatly plummeted.
But drug overdoses – which includes death by alcohol poisoning as well as overdoses on drugs such as opioids—have been growing drastically since 2010. They’re still not a top cause of death (compare against cancer and heart disease) for the population as a whole, but the rapid rise in deaths is very concerning.
The main driver in this increase has been increased deaths from opioids, and primarily illegal ones at that. The Centers for Disease Control and Prevention noted that 2/3 of drug overdose deaths in 2017 were from opioids, and there was a 12% increase in the rate of opioid overdose death rates between 2016 and 2017. However, the number of deaths for prescription opioids remained level, synthetic non-prescription opioids like fentanyl used illegally, greatly boosted the number.
According to the CDC, overdose death rates are highest among men age 25-44, but the rates are also greatly increasing over many age ranges and for both sexes.
As noted in the hint, fentanyl was part of the mixture of drugs that killed Prince (and also Tom Petty). Prescription fentanyl is often used for pain relief, in the form of slow-release patches. However, many people have gotten fentanyl in the black market (or, sometimes, heroin has been laced with fentanyl for a more potent high). Fentanyl has surpassed heroin as the leading cause of drug overdose deaths.
Hopefully, this trend will turn around, as with the cancer and heart disease cases. As we’ve seen with these trends, things don’t always just keep going up or keep going down.
So how did you do for your guesses?
Check out the other quizzes at Storyline as well — I’ve been having fun doing my own guesses.
Related Posts
Geography of Mortality: State Ranking by Increase in Total Mortality and COVID Mortality, 2020-2021, Provisional
Mortality with Meep: Major U.S. Mortality trends 1955-2017
Movember Fundraising: Men and Suicide
