Mortality Nuggets: Life Expectancy, Worldwide COVID Deaths, Homicides, and More
by meep
This is the last of my “throwaway” posts that I’m clearing out so that I can do a deep dive into U.S. COVID mortality statistics.
There will be COVID-related material below, including U.S., but I wanted to keep this separate from my own analysis.
Life expectancy lowered… kind of
US life expectancy drops dramatically due to COVID-19
U.S. life expectancy just dropped by more than a year — the largest decline in decades — as a result of the sheer number of deaths from COVID-19, according to estimates from a new study.
The study researchers project that, due to the COVID-19 pandemic, the average U.S. life expectancy in 2020 will drop by 1.13 years, bringing it to 77.48 years, according to the study, published Thursday (Jan. 14) in the journal Proceedings of the National Academy of Sciences. That’s the largest single-year decline in life expectancy in at least 40 years, and it would bring the country’s life expectancy down its lowest level since 2003, the researchers said.
So, before I copy more over, I want to just provide a graph and explain:
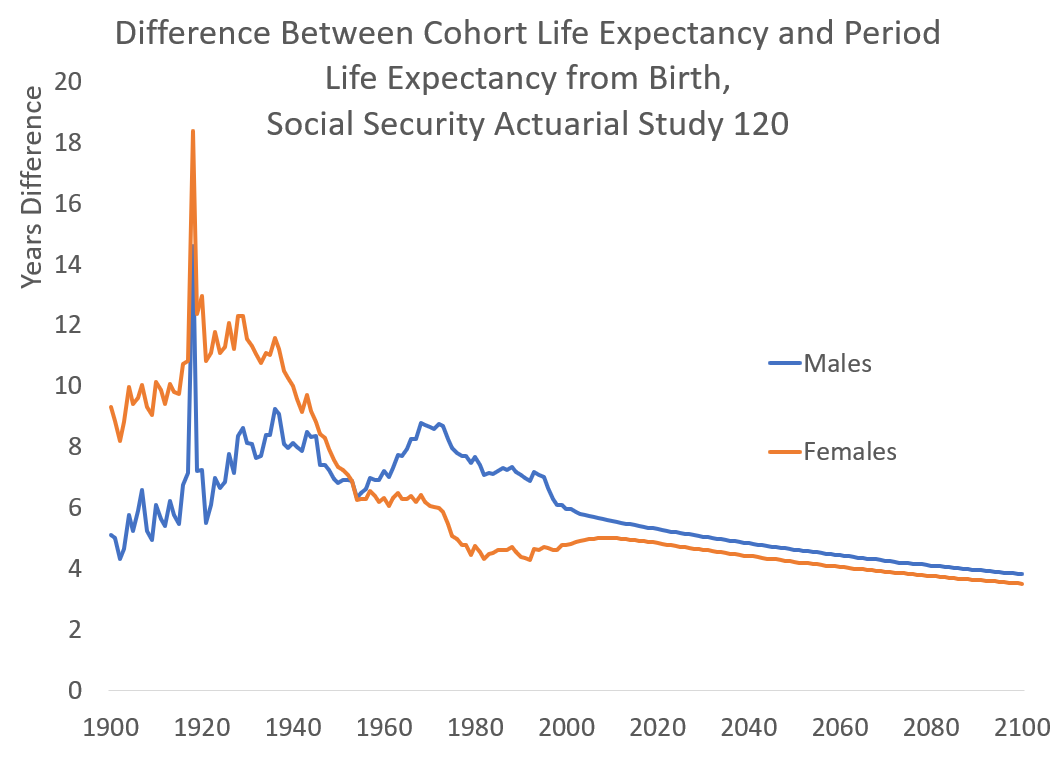
Cohort life expectancy is life expectancy if we follow the mortality pattern assuming you were born in year x, period life expectancy is a construct we use to capture how mortality is for that calendar year. Nobody ever experiences the period life expectancy as an individual. For your own retirement planning, you should use cohort life expectancy (and, of course, that assumes projections of mortality trends in the future).
My old post:
Let me walk you through what we’re looking at here. In general, because mortality in general has been improving, the cohort life expectancy will be higher than the calendar year life expectancy for the same year. This has not always been true throughout history (think of the Black Death).
We see an anomaly in 1918 – in which the life expectancy difference spikes. And that’s because that year, a bunch of young adults died from the Spanish flu… but the kids born in 1918 were not disproportionately affected. If you have a pandemic that affects relatively young people — or a mortality trend (like opioid overdoses) that affects people at young-ish ages — that will have a disproportionate effect on that calendar year life expectancy.
The rule of thumb is that the more rapid the mortality improvement over a projected lifetime, the larger the difference between the cohort and period life expectancy.
Talking about “life expectancy” for 2020 is a shorthand, but it’s not very meaningful if you need to think about how long you or other relatives you know will actually live. They use life expectancy because “age-adjusted mortality rate” is something people aren’t used to thinking about.
Back to the piece.
Life expectancy in the U.S. rarely declines, and when it does, it makes headlines. Most recently, U.S. life expectancy declined by 0.1 years in 2015, 2016 and 2017 — a trend that was attributed to rises in “deaths of despair,” including drug overdose and suicide. The new estimated decline due to COVID-19 is 10 times greater.
This is true. A big reason those rises in deaths of despair affected the life expectancy so much (while mortality due to heart disease and cancer decreased) is those rises were of young and middle-aged adults, not old people (the ones mainly killed by heart disease and cancer). Another cause has been rising, too: Alzheimer’s and dementia. No, this is not just due to an aging population. I will discuss that another time.
I went through the scientific paper linked: Reductions in 2020 US life expectancy due to COVID-19 and the disproportionate impact on the Black and Latino populations, and I have all sorts of quibbles of how they approached it, but they did reference all their sources, as good researchers should, and that they quoted life expectancies (and at a “precision” I find laughable) is not really important. I think their qualitative results ring true: Black and Hispanic people’s life expectancies will have dropped more than White people’s due to excess COVID mortality, especially among younger and middle-aged Black and Hispanic people. I will be digging more into the ethnic differences later this week.
This is their abstract:
COVID-19 has resulted in a staggering death toll in the United States: over 215,000 by mid-October 2020, according to the Centers for Disease Control and Prevention. Black and Latino Americans have experienced a disproportionate burden of COVID-19 morbidity and mortality, reflecting persistent structural inequalities that increase risk of exposure to COVID-19 and mortality risk for those infected. We estimate life expectancy at birth and at age 65 y for 2020, for the total US population and by race and ethnicity, using four scenarios of deaths—one in which the COVID-19 pandemic had not occurred and three including COVID-19 mortality projections produced by the Institute for Health Metrics and Evaluation. Our medium estimate indicates a reduction in US life expectancy at birth of 1.13 y to 77.48 y, lower than any year since 2003. We also project a 0.87-y reduction in life expectancy at age 65 y. The Black and Latino populations are estimated to experience declines in life expectancy at birth of 2.10 and 3.05 y, respectively, both of which are several times the 0.68-y reduction for Whites. These projections imply an increase of nearly 40% in the Black−White life expectancy gap, from 3.6 y to over 5 y, thereby eliminating progress made in reducing this differential since 2006. Latinos, who have consistently experienced lower mortality than Whites (a phenomenon known as the Latino or Hispanic paradox), would see their more than 3-y survival advantage reduced to less than 1 y.
Life expectancy from age 65 using calendar year mortality rates is not going to be all that different from the cohort tables for 65-year-olds in 2020, so that’s a reasonable comparison. At that age, an increase or decrease of 1 year in remaining life expectancy is a large change.
There is going to be a lot of mortality analysis coming out of this pandemic, as well as standard techniques for “backing out” the 2020 effect. Actuaries like smooth trends when they project, and yeah, we’re not assuming 2021 mortality to be as bad as 2020’s. It’s still going to be pretty bad this January, but I hope by the end of the year, COVID mortality will have been squelched.
Related: WSJ: Covid-19 Deaths to Reverse U.S. Life-Expectancy Gains
How many people died of COVID worldwide?
WSJ: The Covid-19 Death Toll Is Even Worse Than It Looks
World-wide deaths are running far beyond what would have been expected without the pandemic
The recorded death count from the Covid-19 pandemic as of Thursday is nearing 2 million. The true extent is far worse.
More than 2.8 million people have lost their lives due to the pandemic, according to a Wall Street Journal analysis of data from 59 countries and jurisdictions. This tally offers the most comprehensive view yet of the pandemic’s global impact. Deaths in these places last year surged more than 12% above average levels.
Less than two-thirds of that surge has been attributed directly to Covid-19. Public-health experts believe that many, if not most, of the additional deaths were directly linked to the disease, particularly early in the pandemic when testing was sparse. Some of those excess deaths came from indirect fallout, from health-care disruptions, people avoiding the hospital and other issues.
To better understand the pandemic’s global toll, the Journal compiled the most recent available data on deaths from all causes from countries with available records. These countries together account for roughly one-quarter of the world’s population but about three-quarters of all reported deaths from Covid-19 through late last year.
The tally found more than 821,000 additional deaths that aren’t accounted for in governments’ official Covid-19 death counts.
So, here’s the deal. Excess mortality is, indeed, far higher than the official COVID death toll.
I agree that in the first wave in the spring (and we’re going to ignore China for right now), many COVID deaths were recorded as something else. Even for those at hospitals, testing capability was sparse, and not everybody showed the same symptoms. If your heart stops due to a blood clot caused by COVID… but they don’t know you had COVID, well, that was a heart attack, wasn’t it.
In other cases, certain causes of death actually went down. I’m seeing evidence that children’s deaths went down – they’re not a huge part of mortality in most countries anyway, so you don’t notice that reduction in deaths much.
But there is a bunch of excess mortality that is definitely coming from non-COVID causes, which we will see below.
Back to the article:
Because vital statistics can miss connections between deaths and major events, epidemiologists often measure excess deaths – or death tolls above expected levels – to try to capture the fuller picture.
The Journal used the same simple method to calculate expected deaths by averaging death tolls for each country in recent years, then measuring the differences. Tallies for some countries may differ from those nations’ own calculations.
Studying excess deaths helped researchers link a heat wave in France to roughly 15,000 deaths in 2003, and nearly 3,000 fatalities to Hurricane Maria in Puerto Rico in 2017, far above the island government’s original count of 64. Examining excess deaths helps incorporate those who perished over a longer period of time due to issues such as health-care disruptions and power outages.
The United Nations had projected that absent the pandemic, there would have been roughly 59.2 million deaths last year. It’s too early to say by how much the planet exceeded that.
The pandemic may have accelerated the deaths of some people who still would have died in 2020. Still, researchers who examined the impact early in the pandemic found even the oldest victims were losing almost a year of life on average.
That accords with the paper I linked in the prior section.
Testing shortages made it harder to catch the disease early in the pandemic, and some Covid-19 deaths may have been blamed on the flu and pneumonia instead, said Robert Anderson, chief of the mortality-statistics branch at the CDC’s National Center for Health Statistics.
The U.S. has seen other problems. Cerebrovascular diseases like strokes are up too, as are deaths from diabetes and high blood pressure; doctors say people avoiding hospitals and rationing medicine likely had an effect. A spike in deaths among patients with Alzheimer’s disease and dementia has been particularly acute, highlighting the risk of nursing home lockdowns on already fragile residents.
“There may be people dying for other reasons other than the virus, particularly in a situation where they are isolated for a length of time, they may not have access to care, they may be afraid to seek care,” Mr. Anderson of the National Center for Health Statistics said.
In any case, yes, there was a lot of excess mortality last year and right now. Most of it is directly due to COVID (that is, the person got the disease, which directly caused their death via how the disease progresses/“works”.) However, there is a substantial amount of excess mortality that are secondary effects, and, frankly, dead is dead.
The next mortality trend of 2020 I’m writing about is probably not directly or even indirectly related to COVID, because we’ve had large fluctuations before.
Homicides are up in U.S. cities
New York City — WSJ: New York City Homicides and Shootings Rose Dramatically in 2020
Homicides and shootings in New York City rose sharply in 2020, New York Police Department officials said Thursday, as police resources were stretched thin by the Covid-19 pandemic and responses to large-scale protests over the killing of George Floyd.
The number of murders in the city rose to 462 last year, up nearly 45% from 319 in 2019, according to the NYPD. The increase accompanied a steep rise in gun violence more intense than any seen in the previous 20 years, according to police statistics.
The city recorded 1,531 shootings in 2020, 97% more than the 777 in 2019. Data showed the number of shooting victims in the city more than doubled to 1,868 in 2020 from 923 in 2019. The number of shooting victims exceeds the number of shootings because multiple people may be shot in a single incident.
Chicago — Hey Jackass: 2020 Year Totals
2020 Totals (vs 2019)
Shot & Killed: 719 (+55%)
Shot & Wounded: 3455(+51%)
Total Shot: 4174 (+52%)
Total Homicides: 792 (+53%)
Increases over 50% are substantial, I hope you know.

NPR: Massive 1-Year Rise In Homicide Rates Collided With The Pandemic In 2020
Last year, an alarming increase in homicides left communities — often in lockdown — reeling as officials searched for answers. That was evident at lots of news conferences as police officials and mayors in Chicago, Los Angeles and New York City rolled out dire news.
At the end of 2020, Chicago police reported more than 750 murders, a jump of more than 50% compared with 2019. By mid-December, Los Angeles saw a 30% increase over the previous year with 322 homicides. There were 437 homicides in New York City by Dec. 20, nearly 40% more than the previous year.
…..
New Orleans-based data consultant Jeff Asher studied crime rates in more than 50 cities and says the crime spikes aren’t just happening in big cities. With the numbers of homicides spiking in many places, Asher expects the final statistics for 2020 to tell a startlingly grim story.“We’re going to see, historically, the largest one-year rise in murder that we’ve ever seen,” he says.
Asher says it has been more than a half-century since the country saw a year-to-year murder rate that jumped nearly 13%.
13%, huh? That’s about how much deaths increased in 2020 compared to 2019.
Even with gradual reopenings, Rosenfeld says, the number of property crimes in 2020 was still much lower than the previous year, but homicides climbed significantly in 28 cities he studied — places such as St. Louis, Kansas City and Milwaukee. He also says the risk of homicide in neighborhoods often plagued by gun violence was much higher in 2020 than in 2019.
Kim Davies, interim dean of Pamplin College of Arts, Humanities, and Social Sciences Department of Social Sciences at Augusta University, says that’s where confrontational homicide is often the cause.
“It’s homicide where two people, mostly men, get into some kind of confrontation over, you know, who’s more manly and nobody backs down,” says Davies. “And before you know it, somebody pulls a weapon and it often ends in violence.”
Davies says that’s especially true during a time when so many are in flux as the country wrestles both with the pandemic and social unrest. The questions now are whether the big jump in murders is a one-year blip and what might push that back down. Yale University Law Professor Tracey Meares says COVID-19 vaccines will help since the pandemic has prevented many anti-violence programs from operating.
I do wonder how effective “anti-violence” programs are. One issue can be that many people have been released from jail or prison due to the danger of COVID spreading through confined spaces; I think it’s a reasonable thing to cut sentences short to reduce prison crowding in this situation.
Perhaps the various protests and riots this summer also got people worked up. Maybe cops were less likely to confront anybody over anything due to the risk of infection, not to mention political aspects in play.
But it can also be that many people have been cooped up with the same people for too long and just can’t take it anymore.
More coverage of homicide increases:
- The Economist: America is experiencing the worst recorded increase in its national murder rate
- Vox: The rise in murders in the US, explained – I will not go into their explanation (short version: it’s complicated), but the following sentence from Vox made me laugh: “That a decades-long phenomenon is still so hard to explain shows the need for humility before jumping to conclusions about the current trends.” — I agree, but intellectual humility has been extremely scarce of late.
- WaPo: 2020 saw an unprecedented spike in homicides from big cities to small towns
- Time: 2020 Will End as One of America’s Most Violent Years in Decades
- Christian Science Monitor: 2020’s murder increase is ‘unprecedented.’ But is it a blip?
- CNN: Despite Covid-19 and stay-at-home orders, 2020 saw an increase in homicides across the US
I love when there’s “despite” in a headline because often it works better as “Due to” or “Because”.
Suicide
This is one where I will definitely be digging more — suicide and drug overdose.
I found out about this due to a piece in the National Review: A Closer Look at the Death Toll of 2020
I will not quote that, because the important bit is going to the research paper mentioned.
NBER: Deaths of Despair and the Incidence of Excess Mortality in 2020 – by Casey B. Mulligan
Weekly mortality through October 3 is partitioned into normal deaths, COVID, and nonCOVID excess deaths (NCEDs). Before March, the excess is negative for the elderly, likely due to the mild flu season. From March onward, excess deaths are approximately 250,000 of which about 17,000 appear to be a COVID undercount and 30,000 non-COVID. Deaths of despair (drug overdose, suicide, alcohol) in 2017 and 2018 are good predictors of the demographic groups with NCEDs in 2020. The NCEDs are disproportionately experienced by men aged 15-55, including men aged 15-25. Local data on opioid overdoses further support the hypothesis that the pandemic and recession were associated with a 10 to 60 percent increase in deaths of despair above already high pre-pandemic levels.
I actually like that his range is so broad. I get tired of point estimates when I know there’s a lot of uncertainty in the work.
PDF link: DEATHS OF DESPAIR AND THE INCIDENCE OF EXCESS MORTALITY IN 2020
I will be digging into excess mortality by age, sex, race, etc. to the extent I can over the next few weeks.
I have looked at his paper, and there were certain of his extrapolations that I did not like. But the following figure is very convincing to me:

First, the dashed blue line has to do with unemployment insurance claims (he scaled it so that it would be on the same scale as the other two lines).
The red line is his estimate of COVID deaths for the group – he acknowledges that there were undercounts of COVID deaths, especially in the first peak. You see the April peak and the summer peak in this.
And then there’s the solid blue lines.
That’s the non-COVID excess deaths. Notice the slow rise from April to a level in summer higher than COVID deaths.
I agree that this is what happened, but I will do my own data analysis, and attempt to support this as well. I will not be using the same groupings he did.
Leftover mortality stories
- NY Post: Cuomo still refuses to disclose total number of COVID-19 nursing home deaths: watchdog
- Twitter thread in which I complain about total deaths data from North Carolina
- Think Advisor: How Nursing Home Mortality Rate From COVID-19 Varies in 50 States
- Covid Actuarial Response Group: 2020 Mortality in Context – this is the UK.
- Sky News: COVID-19: How mortality rates in 2020 compare with past decades and centuries – England and Wales – same as above – WWII hit England much harder than it hit the U.S., for obvious reasons
- Think Advisor: COVID-19 Unemployment Could Kill 1.37M: Economists
- medRXiv: 2.5 Million Person-Years of Life Have Been Lost Due to COVID-19 in the United States
- CDC: Mortality in the United States, 2019
- Dale Hall of the Society of Actuaries at Think Advisor: Insights on the Socioeconomic Impact on Mortality – this has nothing to do with COVID, and I may do a video on what the SOA has done with its mortality research
- WBEZ: COVID-19 Is Killing More Illinois Nursing Home Residents Than Ever, According To State Data
- Wirepoints: As COVID Deaths Soar In Illinois Nursing Homes, Let’s Revisit Who ‘Threw Granny Under The Bus,’ And What Went With Her – Wirepoints
- California Department of Public Health: California Deaths Due to All Causes, January 2017 to November 2020 – it’s by county…. I wish I had something to rip all this data into a nicely structured database. [I know they have a database… how can I get that extract?] – btw, lots more deaths in April 2020 in LA than in April 2019. They got hit by the spring wave.
As mentioned, I will be doing my own data analysis of the CDC total mortality data, and I thank many people who pointed me to data sets I hadn’t been using (yet) there.
Enjoy!
Related Posts
Mortality Monday: Suspicious Russian Deaths
Mortality with Meep: No, Retiring Later Doesn't Make You Die Sooner... or Later
Mortality Basics with Meep: Age-Adjusted Death Rates v. Crude Death Rates for U.S. 1968-2020
