Mortality with Meep: On Excess non-COVID Mortality in 2020
by meep
The Society of Actuaries recently published research based on preliminary mortality data from the CDC, where some causes of death are broken out by age through the third quarter of 2020 (and some only through the 2nd quarter of 2020).
The research is here: U.S. Population Mortality Observations: Preview of 2020 Experience. That’s a direct link to the PDF, and here’s a link to the landing page, just in case you need that info.
Video presentation on the research
Here is a video I did covering some main non-COVID mortality for 2020.
The video is kind of long (38 minutes), so I will grab some key graphs and tables to share with you below. I will be skipping over some of the tables and graphs I cover in the video — it is, after all, a lot of material.
Increased non-COVID mortality
I have been writing all sorts of material about increased mortality in 2020, and specifically COVID-related mortality. So I will not be focusing on that in this post. Instead, I want to point out the non-COVID mortality increase in the U.S.
Let’s first look at figure 1:
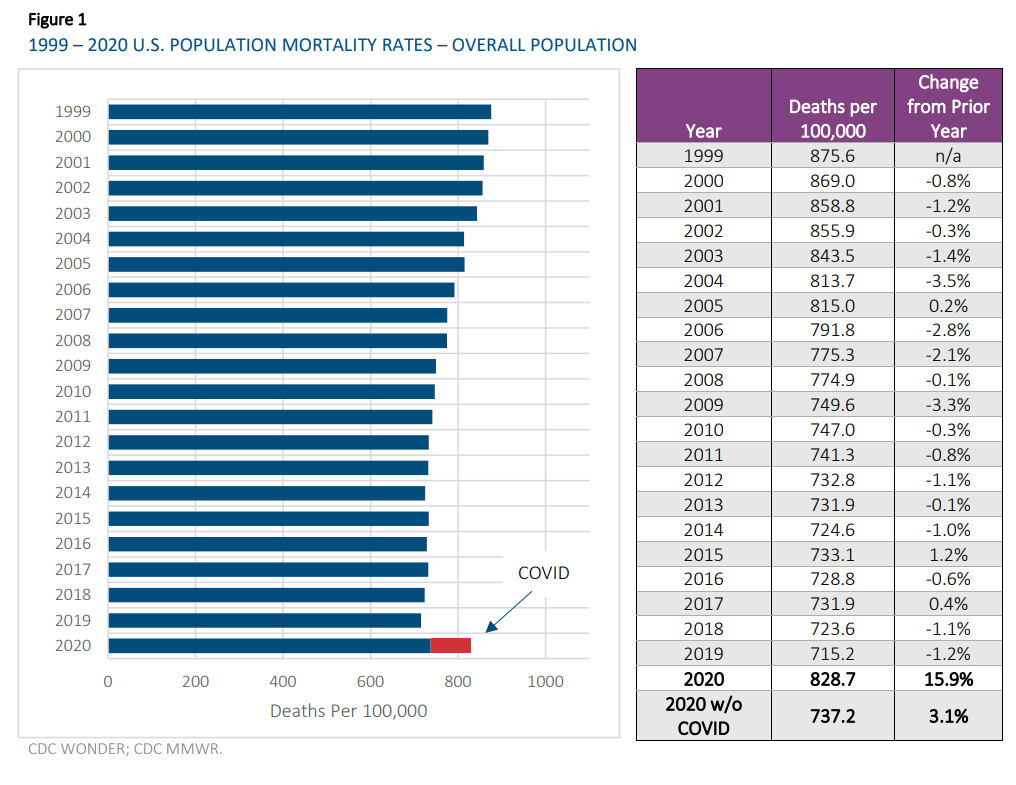
Looking at the 2020 bar, when we include COVID deaths, there is an almost 16% increase in the number of deaths from 2019 to 2020. (Oh look, that’s what I estimated back in January — at the upper end of my 14% – 16% range, but still in there.)
At that level, of about 829 deaths per 100,000 (or a raw death rate of about 0.83%), you’d have to go back to 2003-2004 to get a similar level.
Note: this is not really an appropriate head-to-head year-to-year comparison. The age structure of the population in 2003-2004 was a bit younger compared to the population in 2020. In a future post, I will explain how age-adjusted death rates are calculated, but that’s not really important for comparing 2019 to 2020. It’s when we make comparisons over decades that we have a problem.
If we remove the estimated count of COVID deaths, we still have an overall increase in deaths of 3.1%. The 737 deaths per 100,000 (or a 0.74% raw death rate), is at a level similar to 2011.
There has been a large focus on the COVID deaths – after all, it did contribute a 12.8% increase to the population death rates – but I think the non-COVID death increases have gotten short shrift.
Let’s see which age groups may be contributing to this increase in non-COVID deaths.
All causes versus non-COVID causes of death, by age group
Let’s look at Table 2 from the report:
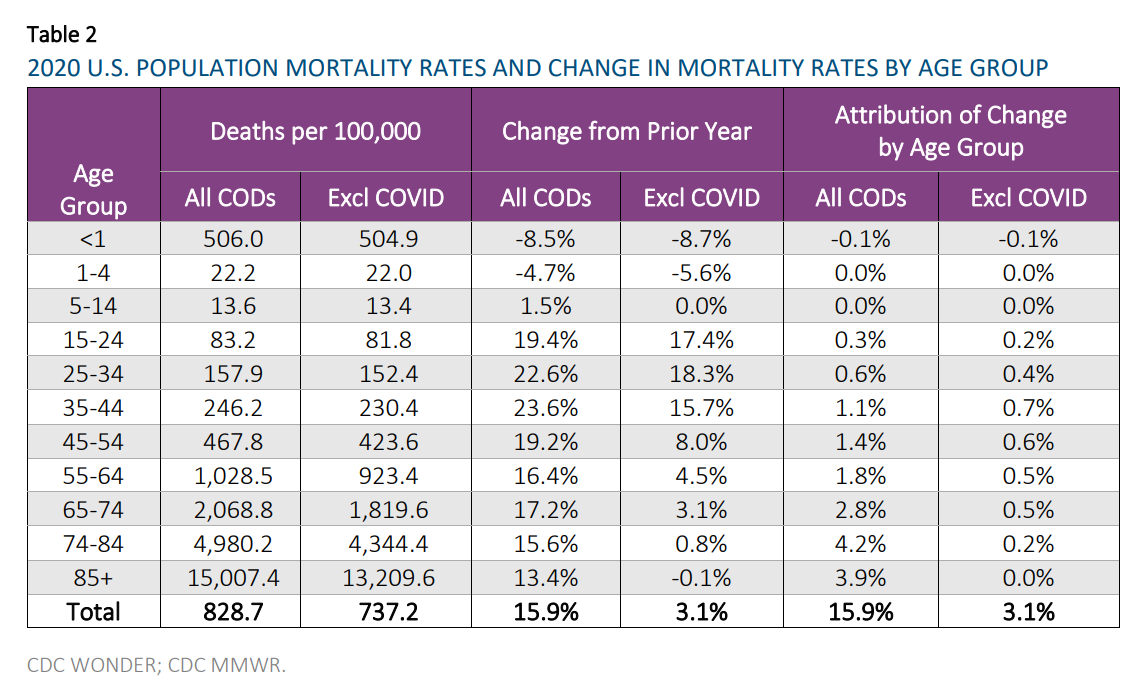
I will step you through the columns. This one is organized by age group, and is the death rate for each group from 2020.
COD = “cause of death”
I will do my own graphs of these amounts, so you can see what I specifically want you to see.
Let’s take the death rates from the All CODs (basically, all deaths) and the Excl COVID (all non-COVID deaths) columns:

As I note in the video, we see an escalation in death rates by age, fitting the Gompertz-Makeham formula very well. That’s with or without COVID. (I leave the curve-fitting as an exercise for the reader).
We can barely see the difference between the two curves for younger ages, due to the vertical scale. So let’s focus in on that:

Okay, so we see noticeable COVID mortality for ages 35 and above, but now we’re at very small mortality levels.
But the question we have is: how does this compare to 2019 mortality?
Notable non-COVID mortality increase for those under age 45
Here is a graph showing 2020 mortality curves by age group, versus the 2019 mortality — and I’m focusing on under age 55 for now — you will see why in a moment:
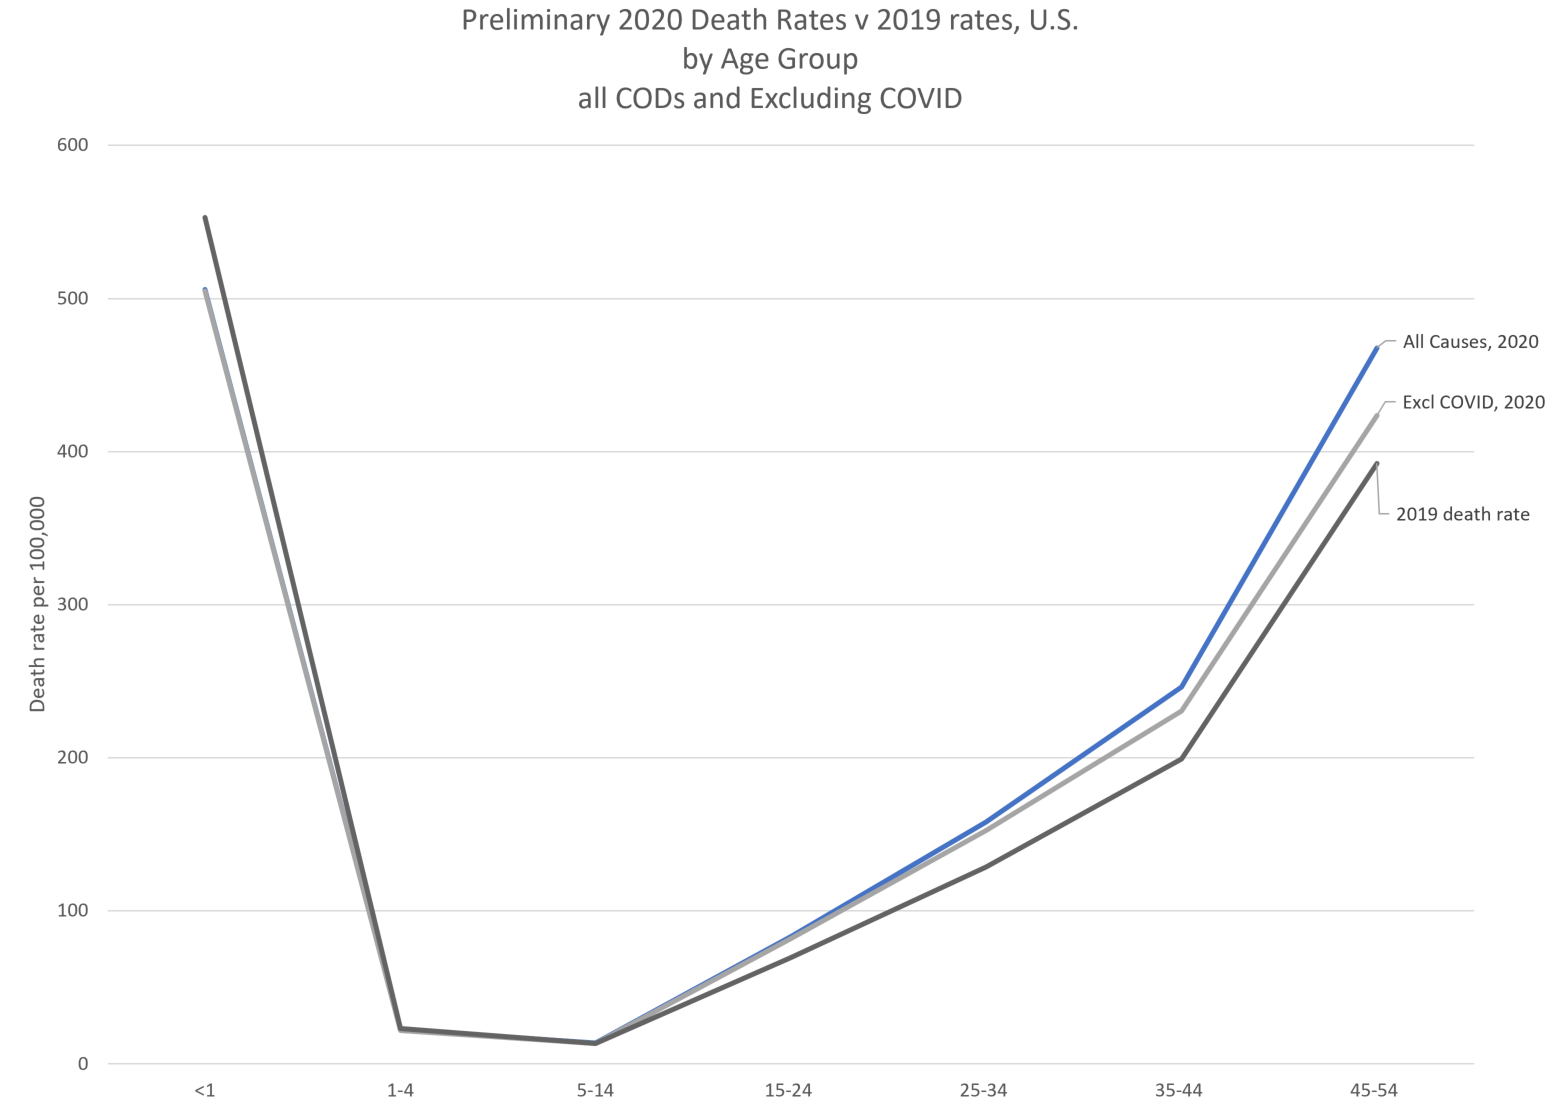
Even when we exclude COVID, we can see that there was an increase in mortality for those age 15 – 54. Something other than COVID is driving that extra mortality.
When we graph the increase in mortality in percentage terms, we can really see it:
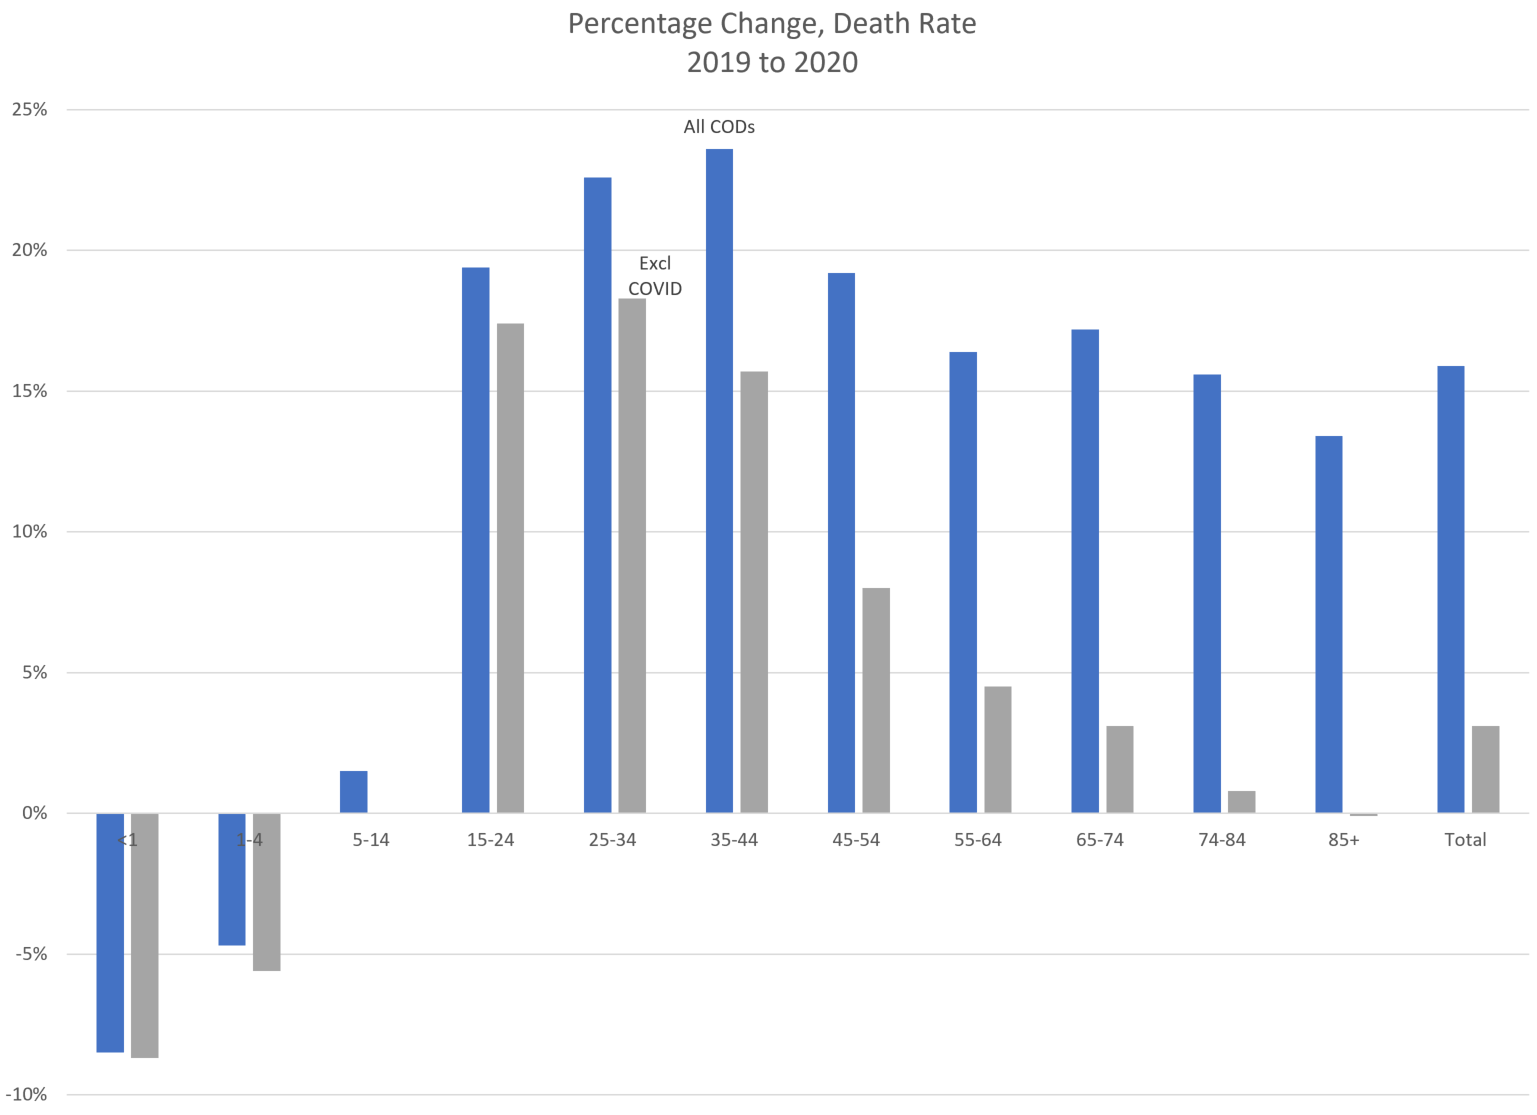
Notes from graph:
- All of the excess mortality for age 85+ can be explained by COVID, essentially
- Very little of the excess mortality for those age 15-24 can be explained by COVID
- There is a lot of excess mortality for those age 25-44 not explained by COVID
Now, there can be many reasons for this.
Potential drivers of excess mortality for young adults
Unfortunately, we don’t have great data for detailed cause of death for the whole year of 2020. The CDC released some data through the third quarter of 2020, and some data through only the second quarter of 2020 (and really detailed data, such as drug overdoses versus falls — both of which are categorized as accidental deaths — will take longer for us to get).
So let’s look at the “external” causes of death: accidents, suicide, and assault.
As noted, accidents include a variety of things: falls (big killer of older folks), vehicle accidents, drug overdoses, drowning, etc.
Suicide is self-explanatory, and assault is primarily homicides of various sorts.
We have these data only through 2020Q2.
But let’s look at it overall:
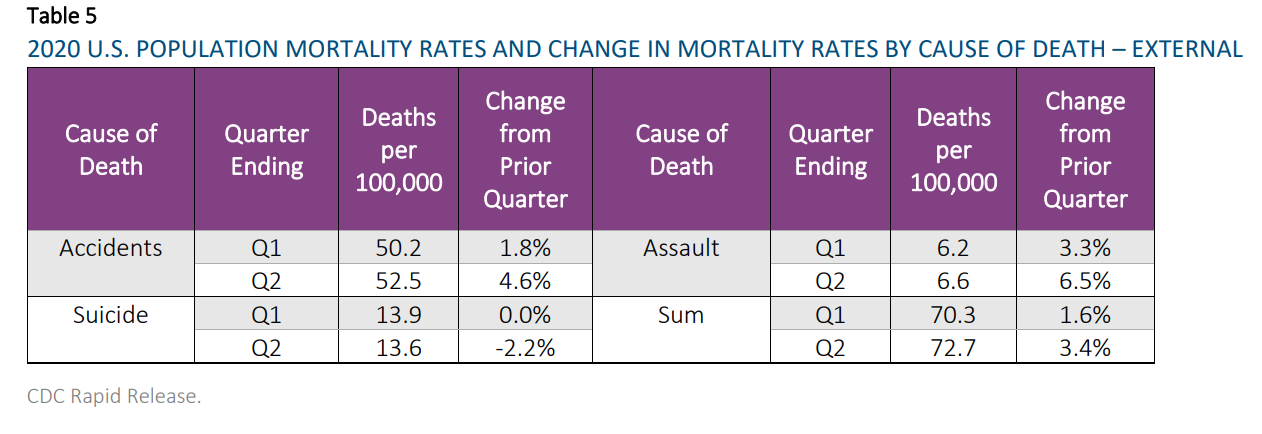
By the way, I was corrected by the SOA researcher in how I was explaining the quarterly stats: the rate is for the 12-month period ending that quarter, not that quarter’s experience annualized. Both choices are legitimate, but the 12-month period ending approach is better, because it averages out effects of seasonality. I will do a separate video/post on that issue.
In the second quarter of 2020:
- Increase in accidental deaths
- Decrease in suicides
- Large increase in assaults (yikes)
Of the three “external” causes, accidents have the highest rate for the general population. Let’s take a look at what the age structure looks like:

For figure 23, you’ll see there are two charts. It’s the same data in both, just with different vertical scales. The highest death rate by far is for the oldest age groups. Their primary cause of accidental deaths is falling.
Those “I’ve fallen and I can’t get up!” ads really aren’t that funny.
There have been increasing rates of fatal falls for older people, and we’re not exactly sure why. As I mention in the video, serious injury from falls is an indication of frailty (and, obviously, serious injury doesn’t make that frailty any better.) This is not just a U.S. phenomenon. I will have to go back to this another time.
In any case, the second graph excludes the 75+ groups so we can see trends in accidental deaths for younger ages… and it’s bad news there, too.
Even before 2020, the increase in accidental deaths for adults under age 75 has been driven by drug overdoses.
More importantly, we can see very steep increases in 2020…
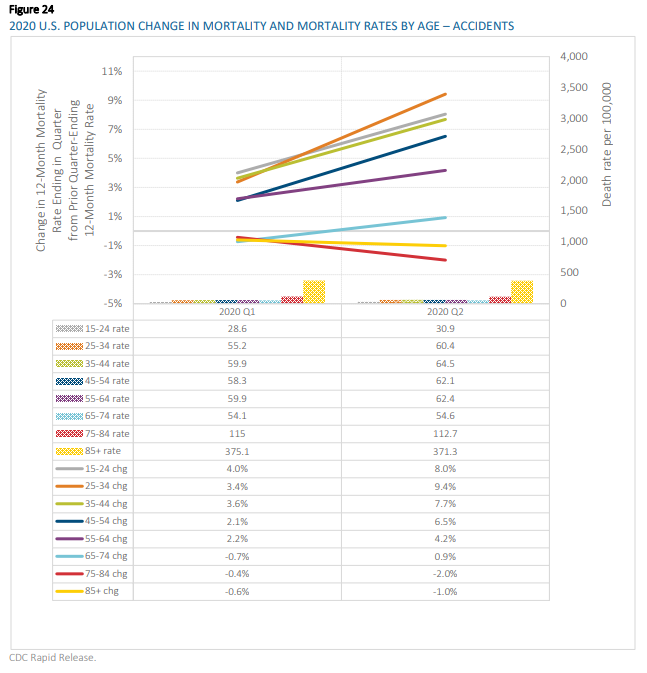
Those are very large quarter-over-quarter changes for age groups under age 75. Interesting that the old folks saw fewer accidental deaths, but it may just be that the most frail seniors (who would have died from falls) died from COVID before they died by falls.
We know that fatal car accidents increased in 2020, and there are indications that drug overdoses were also up — we just don’t have the age breakouts for the full year yet. Imagine when we get the July-September numbers…. I wouldn’t be surprised if they are even worse than 2020Q2.
Happy news: cancer death rates continue to improve
As with my video, let me end with some happy news. Yes, childhood mortality was down in 2020, which is good, but one of the main causes of death, cancer, showed (slow) rate improvement through 2020Q3.
Here’s the graph:
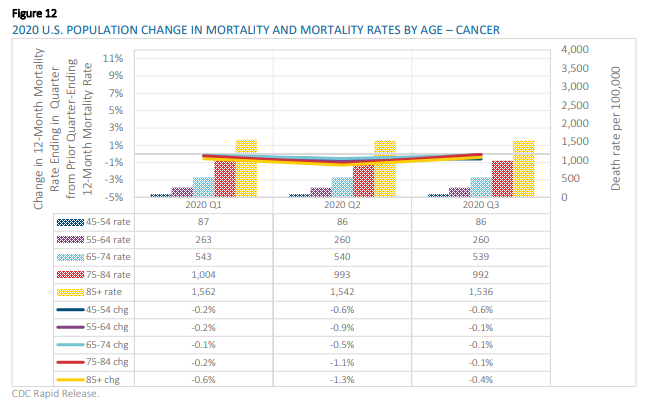
The lines show the percentage change quarter-to-quarter, and it’s negative for every age group 45 and older.
No, these aren’t huge decreases, but it shows continuing improvement which has been occurring for decades. Some of the cancer death rate improvement comes from the decrease in smoking, but that’s really decades in the past at this point. Most of the recent improvement has been from improved detection and treatment.
Stu had no issue getting treatment all last year, though obviously there was additional screening when he went for his treatments. Our biggest disruption was his cancer center no longer being covered by our insurance… but another good one was even closer, so it’s not been a problem there.
That said, don’t forgo your cancer screenings, y’all!
Health care utilization outside of COVID just plain crashed last year, and I think the main issue of missed or delayed cancer screenings is that we may a period of slowed cancer mortality improvement, not that cancer mortality will get worse.
Still, huzzah for reduced cancer mortality!
Related Posts
Mortality Monday: Broken Heart Syndrome
Can the Government Tell If You're Dead or Alive?
Misleading Gun Death Stats: "Gun Mortality" State Rankings
