Excess Mortality For Working Age Adults Way Up in Third Quarter of 2021, Driven By Covid and Drug Overdoses
by meep
Several people emailed me this article this morning:
The Center Square: Indiana life insurance CEO says deaths are up 40% among people ages 18-64
The head of Indianapolis-based insurance company OneAmerica said the death rate is up a stunning 40% from pre-pandemic levels among working-age people.
“We are seeing, right now, the highest death rates we have seen in the history of this business – not just at OneAmerica,” the company’s CEO Scott Davison said during an online news conference this week. “The data is consistent across every player in that business.”
OneAmerica is a $100 billion insurance company that has had its headquarters in Indianapolis since 1877. The company has approximately 2,400 employees and sells life insurance, including group life insurance to employers in the state.
Davison said the increase in deaths represents “huge, huge numbers,” and that’s it’s not elderly people who are dying, but “primarily working-age people 18 to 64” who are the employees of companies that have group life insurance plans through OneAmerica.
“And what we saw just in third quarter, we’re seeing it continue into fourth quarter, is that death rates are up 40% over what they were pre-pandemic,” he said.
“Just to give you an idea of how bad that is, a three-sigma or a one-in-200-year catastrophe would be 10% increase over pre-pandemic,” he said. “So 40% is just unheard of.”
It is odd to call a 10% increase in mortality a 1-in-200-year catastrophe given:
- the Spanish flu pandemic was just a wee bit over 100 years ago
- the mortality hit in 1918 was far more than an increase of 10% in mortality at the time
To be sure, it was only a one-year hit, and we’re on a two-year journey so far. The full impact has been more than we thought and 2021 was definitely worse than 2020.
I don’t want to get into the weeds on the assumptions re: mortality risk, because I’ve had these disputes with others in my field and I need not deal with those right now. I just think it inappropriate to use the “sigma” terminology surrounding mortality risk, given all the trouble others talking about “it’s a six sigma event!” and how frequently those supposedly infrequent events occur.
Yes, I understand some regulators may be using a 10% increase in mortality as their solvency stress scenario. That’s something else entirely.
Mortality increased for younger adults, driven by Covid and non-Covid causes
First, let’s look at the big picture — all the deaths, all causes, all ages:

(Why yes, I’m using one of my new Excel themes, thanks for noticing! It’s Isfahan1, my favorite!)
It’s difficult to really see the trend with stacked columns, and, after all, we want to focus on the working-age groups. That’s age 15-64 (I’m using the ten-year age groupings from CDC Wonder provisional database, going through November 2021).
So let’s switch to a line graph and remove all the age groups we don’t want:

Now I think I’m starting to see what Davison was really looking at, given we have some pretty major fluctuations going on. I’ve talked about the “waves” of COVID — the first wave that hit in the spring of 2020, the second wave in the summer of 2020, the third wave that peaked in January 2021, and then the fall 2021 wave. Maybe we’ll have another wave now, in the winter of 2021-2022, but maybe not.
Note also that it may be a bit foolish to lump in the whole 15-64 age group together — the deaths in the oldest age group are going to drive the totals as a whole, though there may be some large relative movements at younger ages (and there are, as we soon shall see).
As I noted in my talk to Illinois State University: you want to be careful about aggregating prematurely. When it comes to mortality, there is a very steep curve by age. I noted that in an earlier post as well.
Some very large relative increases in mortality
So let us look at how death counts have changed between quarters — to make good comparisons, I decided to take the number of deaths in a given quarter in 2020 and 2021, and compare against the quarter two years before (mainly so the copy/paste would work well in Excel).
Here is the result for all the age groups (including kids and the elderly):

Let me go from left-to-right to help with interpretation.
The first grouping is the first quarter of 2020 — the first spike of COVID deaths didn’t occur until April 2020, so the first quarter of 2020 didn’t really show a bunch of excess deaths. There were a few COVID deaths recorded, but not many. The kind of plus and minus percentage changes is what one would expect from normal noisy trends.
But keep your eye on that age 35-44 grouping, which is the highest positive, because that is our trouble group. I will be talking more about that.
As we get into the next quarter, that’s our first wave of COVID deaths. I notice that for everybody above the age of 45, deaths increase about 20 – 30% compared to the 2nd quarter of 2018. For ages 25 – 44, the increase is over 30%, but given that group generally has few deaths, maybe this isn’t unreasonable in a pandemic death spike.
Indeed, as we march to the right, we notice that the age grouping 35-44 is our highest bar. Now, some of this could be a demographic anomaly – maybe some baby boomlet around this ten-year bracket? But something seriously weird is going on with this group, especially once we get to the third quarter of 2021, which is our delta wave peak. What’s going on here?
By the way, there’s no real way, with these percentages, that the entire group of age 15 – 64 can be seeing an increase of 40% in the number of deaths, though if we’re talking mortality rates, it can be done…. but what I think Davison was talking about was that hideous mortality peak in 2021Q3. Yes, certainly we see something in the range of 40% increases there.
Third quarter was bad.
And the increase for the age 35-44 group is just way off the charts. Are they dropping like flies due to COVID because they’re stubbornly not getting vaccinated (one theory posited to me)? Or maybe the vaccines are killing them (a different question posed to me)?
Or, is it that they generally don’t die of much and it doesn’t take much to move the needle?
The increased mortality for those under age 45 is not new for 2021
I am going to point out something I posted in May 2021, regarding increases in deaths by age groups: On Excess non-COVID Mortality in 2020
Here’s the graph:
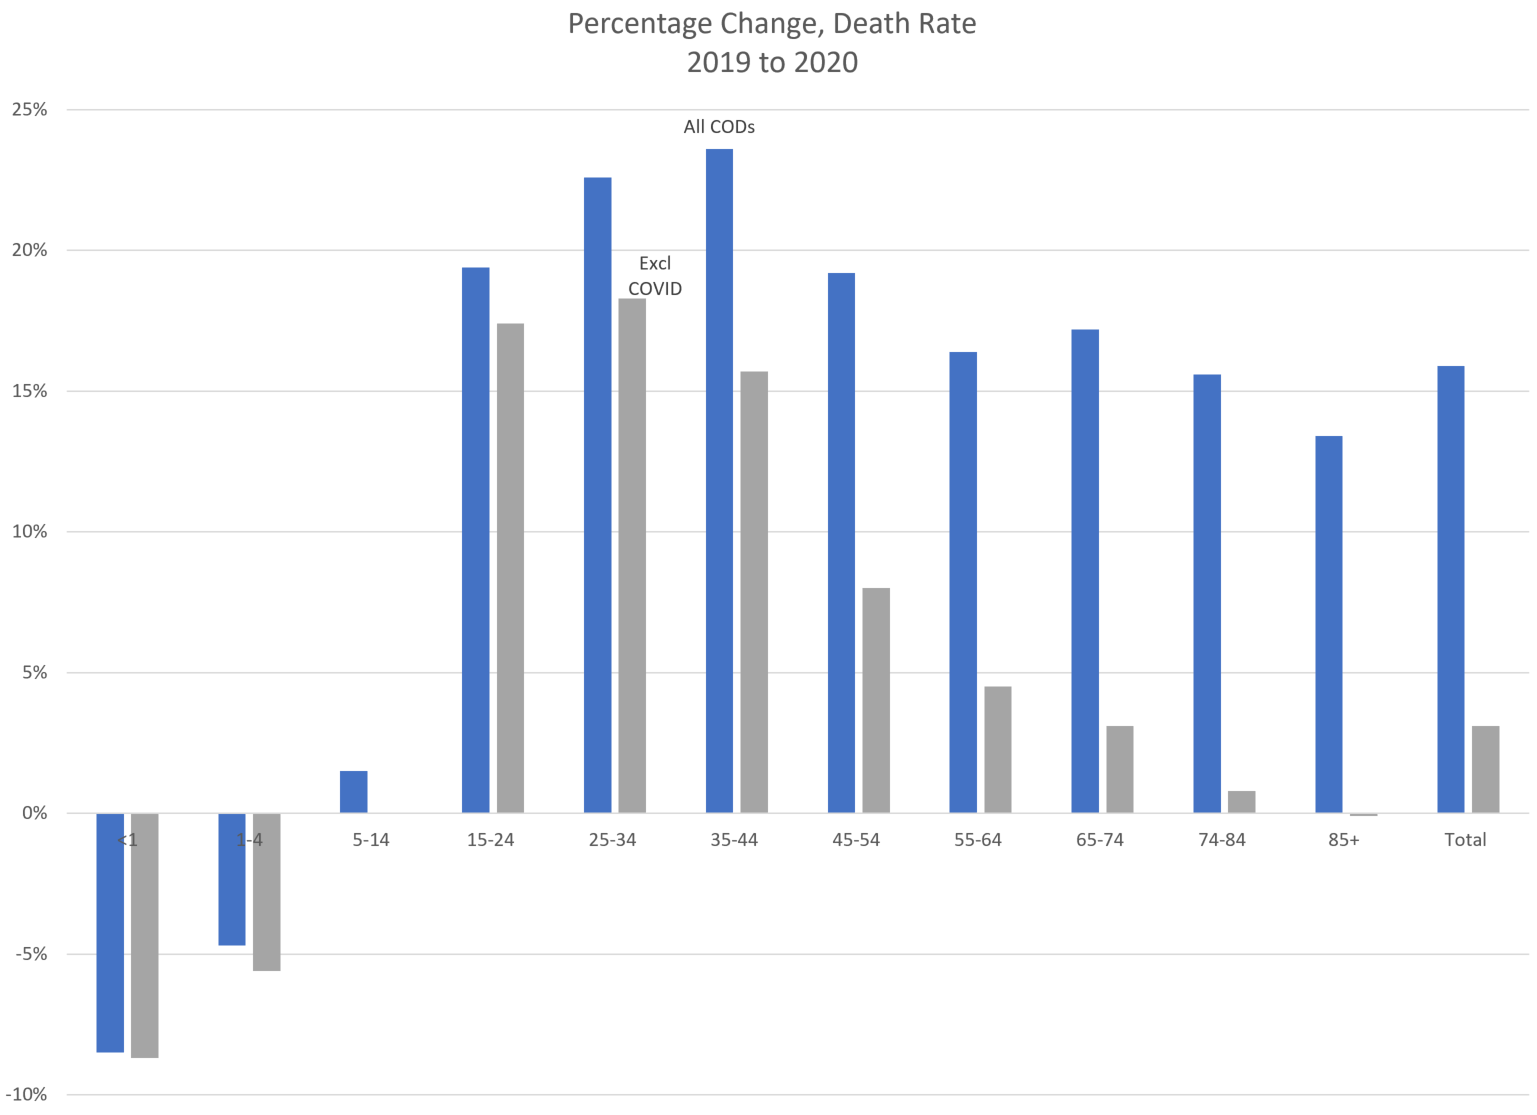
As I noted at the time, for younger adults, specifically age 25-44, a lot of the excess mortality of 2020 was not explained by COVID, and there was some indication that drug overdoses and other accidental causes of death may have been driving the excess mortality.
That was before that group could get any vaccination, so it wasn’t vaccines killing them. So nix that theory (at least for 2020).
Drug overdoses, primarily
I’m sorry to say, the main explanation is drug overdose deaths. And this problem predated the pandemic.
Given the specific outsized mortality increase for those age 35-44, for all the quarters we had data for, I pulled the available underlying cause of death data (and ran into a problem. Back to that in a moment).
Here is a graph:

One big note — the “external causes of death” — which are accidents (includes car accidents and drug overdoses), suicides, and homicides — were an increasing trend before the pandemic. And that was something I already knew. And not only for this age group.
Second note — unfortunately, while death counts do come in fairly rapidly, cause of death data does not. In particular, for causes like drug overdoses you get “Data not shown due to 6 month lag to account for delays in death certificate completion for certain causes of death.” It’s not only drug overdoses this applies to, but drug overdoses are the most significant for the data set I’m trying to put together.
So my graph stops at May 2021, before the delta wave from the summer of 2021.
For young adults, these “external causes of death” have an order of magnitude effect at least as large as COVID.
Drug overdose epidemic: preceded the pandemic, exacerbated by the pandemic
While death certificates for drug overdoses and some other related causes of death are delayed by 6 months to be put into the database, the nasty pattern can be seen right now. Above I showed only the pattern for age 35-44, but I can get the data for all age groups.
Let’s start with the largest category of what we’re interested in — external causes of death — so we can see the order of magnitude differences (these are for all ages).

Transport accidents did go up, as did homicides, but they did not have the effect on total number of deaths as did the “other external causes of accidental injury” aka accidental deaths. So let’s dig into that one.
If we tease apart accidental deaths (which is a weird category, lumping in little old ladies falling down with young adults ODing on fentanyl), we still see a big difference:

Yes, you’re seeing a huge increase in OD deaths in May 2020 in that graph.
Finally, the drug overdose deaths by age group: (I removed age groups with very small numbers)

The whole pattern is a bit strange. Something to think about later. It is quite bizarre given the magnitude of the trend.
While that recent data is bizarre, the older data I have is a bit easier to look at.
Here are a few of my previous posts on the subject:
July 2021: Huge Increase in Death by Drug Overdose in 2020
April 2021: Top Causes of Death in the United States in 2020
April 2017: Mortality Monday: Huge Heroin Death Increases
I knew that drug overdoses where a huge problem and continued to be, as it’s one of the few causes of death with a bad trend. Suicide has a mixed trend, and the other bad trend is for Alzheimer’s. These are all pre-pandemic mortality trends I’m talking about. I don’t go out of my way looking for these trends to continue — indeed, if you look above, the suicide trend may be on hiatus for a bit. Or may have shifted. I don’t know.
Stop with confirmation bias
When I go into looking at these data, I consider multiple angles of interpretation, and if I have preferred interpretations, I think about ways to question or dissect the data that might disprove my preferred take.
Because I actually care about getting things right.
I do have limited time — I’m a bit bugged by the pattern I see above in the drug overdose death counts. It’s weird-looking. Very weird-looking. I may not have time to get back to that for a while (so if one of y’all have time… and know how to use WONDER… hint hint…)
My point is that many people approached me with the link to the story above, with an axe behind their back. Oh, not an axe for my neck, mind you, but I may be trying to use a millstone to grind my grain, and these folks have an axe they want to grind using my millstone. They do not seem to listen that my millstone is intended for turning grain into flour, not for sharpening axes.
Plenty of people are still thinking they will find that perfect piece of evidence to back whatever theory they have constructed around Covid, vaccines, policy, lack of policy, and whatever, and sometimes life is here to say that other things are going on while you’re trying to shove your inappropriate grist into my mill. Because not only is my millstone inappropriate for grinding axes, it doesn’t take all grist.
In any case, the cause of death data I looked at is a mix — I have some through November, with estimates on Covid deaths, but for the particular ages it seems there are a lot of non-Covid deaths to be accounted for. Given the behavior of prior non-Covid deaths and mortality trends from before the pandemic continuing through the pandemic, I am assuming that a lot of excess mortality in the fall of 2021 for younger adults continued being drug overdose deaths.
I find it to be a shame, and I know that people seem to have forgotten about fentanyl, opioids, and these problems because it doesn’t hook into whatever current political argument they want to have, but this has been the worst mortality impact in the U.S. before the pandemic, and, in some groups, it’s a far worse impact even during the pandemic.
I understand that public policy can’t really deal with this right now, but if you’re reading this, at least be aware of this.
Once Covid goes away, the fentanyl problem will still be around.
Related Posts
COVID Mortality with Meep: The John Hopkins Post That Was Yanked
U.S. COVID Mortality: Winter is Coming
Mortality with Meep: Top Causes of Death in the United States in 2020
