Homicide: Trends, 1968-2020, and Provisional Counts Through June 2021
by meep
This is going to be similar to the prior post — Suicide: Trends, 1968-2020, and Provisional Counts Through June 2021 — but there are aspects to homicide statistics that differ in significant ways.
First, I need to remind everybody: these are CDC data that come from their database from death certificates. This is not crime-related reporting. This will not match FBI crime statistics.
There are reasons for differences, in terms of the kind of data collected, the timeline on which they’re reported, and what the purpose of the data is. The CDC is not waiting around for any legal determination, for example, and does not collect information on who committed the assault/homicide, except in two specific cases: to distinguish from suicide, and to indicate “legal intervention” (more on that later). The CDC will collect info on methods of homicide (such as using handgun or poison, etc.)
But remember this is about who dies by homicide, not who commits homicide, though those two are closely linked. Everything we’re looking at here is who is dying. That’s what the CDC cares about. The FBI cares about who is committing crimes. Those are very different perspectives.
Second, as with suicide, this is a “sensitive” cause of death, so there is a delay in getting this info. I have data on this cause of death only up to June 2021.
For this post, to keep it to a reasonable length, I will focus on a statistical breakdown similar to the suicide post: overall trend 1968-2020, demographic trends, and recent death counts. I may look at some other breakdowns in future posts, such as some geographical data, because, unlike some other causes of death, there is definitely a huge geographical influence with respect to homicide.
High-level trend: roller-coaster ride
First, let’s look at the highest level of trend, 1968-2020:

It doesn’t make a huge difference between age-adjusted death rate and crude death rate, but let’s do a little narrative of the ups and downs of the homicide rates.
My data start in 1968, and we have a run-up in homicide rates, peaking in 1974. After which, there is a short-lived downward trend with a local minimum in 1977, turning around and then peaking again in 1980.
Then Reagan! [Look, I don’t know if this is cause-and-effect, we’re just going with a narrative]
During the Reagan years, we do see a decrease until 1987, after which we get increases again (darn that Bush 1….or maybe it was crack), and then our last big peak was in 1991. After which just a huuuuuuuuuuge slide down the homicide death rate scale.
Now, a bunch of things could have done that. Some may have credited Clinton, or tough-on-crime policies of people like Mayor Guiliani in NYC, and the Freakonomics guys infamously credited legalized abortion (and, of course, those who never got born are not counted in death statistics.)
I have heard some credit improved care of things such as bullet wounds, so that what would have been homicide in years past merely became attempted murder.
One of the Freakonomics guys, in a paper from 2004 shows the influence of four factors, but it looks like two are the biggest in what fueled changes: use of crack fueled the increase in homicides and then the resultant increase in incarceration fueled the decrease in homicides.
That might be relevant to the 30% increase in homicides from 2019 to 2020. Also, the results for 2021 don’t look much better.
I will note two increases before 2020: 2001 and 2015.
In 2001, we had the terrorist attacks of September 11th, with over 3000 people killed. That was a 20% increase from 2000, and because terrorist attacks didn’t continue into 2002, a 14% decrease actually got them back to about the same rate it was before.
Then 2015 — a 12% in the age-adjusted death rate by homicide. Some have posited a “Ferguson effect”, related to reactions to the killing of Michael Brown in Ferguson, Missouri in 2014. I will only note, for this post, that once the rate shifted up in 2015, it pretty much stayed elevated, just decreasing a little in 2018. It actually increased in 2016, too.
2020 was a huge year for homicide
Again, to emphasize, we saw a 30% increase in deaths by homicide in 2020.
Yes, that is a huge increase.
Historically, over the period above, here are the largest increases in age-adjusted death rate by homicide, compared to the previous year:
| Rank | Year | Percentage increase |
|---|---|---|
| 1 | 2020 | 30.0% |
| 2 | 2001 | 20.3% |
| 3 | 2015 | 11.8% |
| 4 | 1971 | 8.9% |
| 5 | 2016 | 8.8% |
Guys, that’s really bad.
Sex and racial gap in homicide
Here are the graphs.
First, the 1968-2020 graph, which only has black/white:

Yes, this is one cause of death where black females have a worse rate than white males. I will also note that you can definitely see the effect of Sept. 11th in the white male line — it was a 56% increase for white males that year.
Here is the 1999-2020 graph, which has more racial/ethnic categories:

While a lot of the broad movements you’re seeing in homicide death rates match what you see for black males, you need to remember that that’s only 6% of the population. So the weighted average does get influenced, but all the curves are having different trajectories and weights.
Here you can see how the rate change for each group from 2019 to 2020:

So, across the board, 2020 was pretty bad for homicide. Only Asian females saw a decrease in the age-adjusted death rate for homicide. Everybody else saw an increase.
Age groups and homicide: huge age difference
We can see from the graphs above that the homicide trend is extremely different from suicide trends, but once we dig into age differences, we can see where it is extremely acute.

We saw with suicide that rates were pretty level among all adult age groups. That is very much not the case with homicide. It is concentrated among older teens and young adults. (Yes, people kill babies. That’s ugly.)
Unsurprisingly, that’s why homicide is such a key cause of death for younger people:

With suicide, even though suicide rates for older people are about the same as for younger people, so many things kill older people, it just doesn’t rank. Well, that’s not the case with homicide.
Yes, we know why this happens to be. In general, you have situations where it’s young men trying to kill each other. It’s an extremely old story — go to Shakespeare with Romeo & Juliet for a literary gang war if you want. It’s generally not a cozy murder mystery courtesy Agatha Christie and her ilk, and generally, it’s not much of a mystery of what happened (though getting enough proof for court purposes as to the particular murderer can be difficult).
So we see that age 20 – 34 is the highest rate, and 15-19 years old, 35-44 years old are not far behind. Those are the “hot spots”, as it were, for homicide.
Homicide death numbers, 2018-June 2021, by quarter
So let’s take a look at the numbers by season (recall that approximately — 1st quarter = winter, 2nd quarter = spring, 3rd quarter = summer, 4th quarter = fall).
I’m not going to do all the age groups here. If you’re on the substack post, you can download the spreadsheets and look at all the age group trajectories.
Let’s start with the younger side:

First, remember these are the number of deaths and not rates. So there is a seasonality here — generally numbers go up in summer (Q3), and stay up in autumn a little (Q4), but go down in winter (Q1). From what I’ve seen of Chicago activity, thanks to the Hey Jackass! website, homicide seems to be an outdoor activity, and when the weather is bad, such activity is generally muted.
In 2020, we see activity picking up in spring (Q2), but it really increased in summer and dropped only slightly in the fall. In 2021, as expected, it did drop in winter (though 2021’s winter wasn’t so bad).
But yikes — look at what’s going on with the 15-19 year-olds!

For the next set of ages, they’re all parallel, more or less. This is really not looking good.
I highly doubt it calmed down in the second half of 2021.
Baseline results: HUGE increases in homicides
Well, we can see that the trend for homicides has not been good, and perhaps you’re thinking that the reason is a bunch of people were released from prison during COVID.
So I went looking to find out how many people were released from prison during the pandemic. This page was last updated Feb 8, 2022 as I visited it, and this is what they say:
We found that the moderate drops in prison populations in 2020 were the result of fewer admissions, not more releases. And shockingly, most parole boards granted fewer paroles during 2020 than 2019. The result? As of December 2020, 19 state prison systems were still at 90% capacity or higher.
That’s 19 states. The last time I checked, there were 50 states. So while this particular group wants more people released from prison, especially during the pandemic, perhaps prison releases were related to increases in homicides.
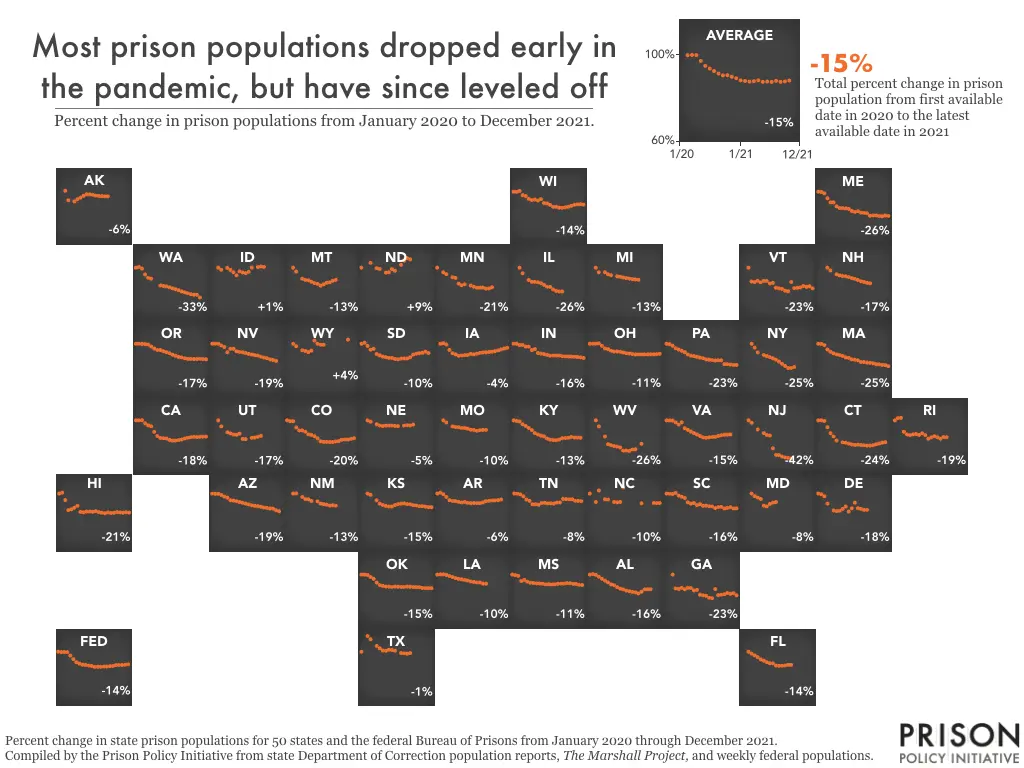
In this article, they have a good data set and visualization of what happened with prison populations during the pandemic. I grabbed their visualization updated for prison populations through December 2021:

The key item is a 15% decrease in prison populations overall, and perhaps that is related to the increase in homicides. They’ve got their data set for prison populations in Appendix A below. As we can see, some states had a big initial drop, and that was it, some others had a more steady decrease (like Arizona). Some of them are somewhat odd, and it can be difficult just looking at these squares to see that Texas’s decrease is actually 1% (something weird looks like it’s going on there with the data with a jump up — might want to be suspicious of what’s going on there).
Even if the decrease is due to lower numbers of people being sent to prison (and part of that could be due to slower court proceedings as everybody was locked down), I think that might still count. As I said, the earlier Freakonomics story showed two large effects on homicide rates: crack cocaine use and number of incarcerated people, with these two things working in opposite directions. I’m not sure what crack use is like now, but we definitely can get our hands on prison population data.
This particular post is long enough for now, so I will use a future post to see if there are any geographic differences in the homicide increases by state — and whether the prison population data has any tie to what we’re seeing in the large increase of homicides in 2020 and continuations into 2021. To be sure, if these have any correlation, they may all have a common correlation in COVID itself, so we need to be careful. Different states had different COVID impacts in 2020, too.
Prior posts on homicide
- Jan 2021: Mortality Nuggets: Life Expectancy, Worldwide COVID Deaths, Homicides, and More
- Dec 2020: Chicago Homicides Quick-Take: 2020 is as Bad as 2016, Just More Concentrated
- Dec 2021: Quick Takes: Homicides and City Partisan Control, Querying WONDER by Gender, and SALT stuff
- Aug 2019: Mortality with Meep: Chicago Homicides
- March 2017: Mortality Monday: Chicago Shootings
- July 2016: Comparing Murder Rates: Fact Check
Spreadsheets will be provided on the substack post.
Related Posts
Good Friday: St. Matthew Passion and Data Update
2021 U.S. Mortality News Explainer: Death Rates, Life Expectancy, and More
Geography of Mortality: State Ranking by Increase in Total Mortality and COVID Mortality, 2020-2021, Provisional
