U.S. life expectancy fell almost 1 year (again) in 2021 - what does that mean?
by meep
It means I will explain what period life expectancy means (again).
First, the media coverage.
U.S. period life expectancy in 2021 down to 76.1 years
NY Times: U.S. Life Expectancy Falls Again in ‘Historic’ Setback
The average life expectancy of Americans fell precipitously in 2020 and 2021, the sharpest two-year decline in nearly 100 years and a stark reminder of the toll exacted on the nation by the continuing coronavirus pandemic.
In 2021, the average American could expect to live until the age of 76, federal health researchers reported on Wednesday. The figure represents a loss of almost three years since 2019, when Americans could expect to live, on average, nearly 79 years.
The reduction has been particularly steep among Native Americans and Alaska Natives, the National Center for Health Statistics reported. Average life expectancy in those groups was shortened by four years in 2020 alone.
Think Advisor: U.S. Life Expectancy Fell Another 1.2 Years in 2021
The COVID-19 pandemic continued to drive down Americans’ life expectancy in 2021.
The U.S. Centers for Disease Control and Prevention is reporting, based on early data, that overall life expectancy at birth fell by 1.2 years between 2020 and 2021, to 76.1 years, according to a new report and a comparable report based on 2020 data.
For 65-year-olds, life expectancy fell by 0.5 years, to 18.3 years. The decrease at age 65 was about the same for men and for women.
Since 2019 — the first full year before the start of the pandemic — U.S. life expectancy at birth has dropped a total of 2.7 years, and life expectancy at age 65 has dropped 1.3 years.
COVID-19 has affected mortality by killing people directly, by affecting people’s access to care for other conditions, and, possibly, by leading to economic and social changes that may have contributed to increases in the number of deaths related to accidents, liver problems, suicide and homicide.
CDC report is here: Provisional Life Expectancy Estimates for 2021
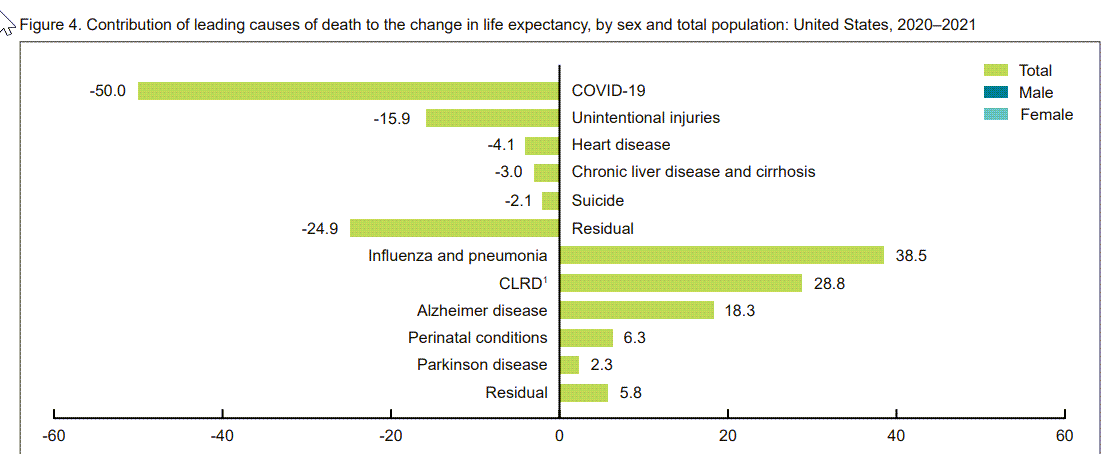
A few graphs – life expectancy and contribution by cause of death
Here are two graphs from the report that appear in my video.
Period life expectancy overall and by sex, 2000-2021 (provisional):

Contribution to change in life expectancy 2020-2021:
Video explainer
Period life expectancy v. cohort life expectancy
Period life expectancy is the life expectancy you hear reported each year in the press, that gets released by the CDC in these reports, etc.
It is taking the mortality experience for the whole population during a specific time period, usually a single year (in this case, 2021), and then calculating life expectancy as if the mortality seen by the full population during that year was the one a person would be seeing during a lifetime. No person actually lives through a mortality pattern like this, because we’re not in a “steady state” for mortality.
Period life expectancy is the flip-side of age-adjusted mortality rates.
Cohort life expectancy is the life expectancy based on one’s birth year, which is the relevant life expectancy for things such as retirement planning. As an actuary, I’m looking at this measure for pensions and annuities. Well, no, I’m not.
I’m actually looking at the full distribution of possibilities, not the weighted average.
Here are prior posts on these concepts:
- Feb 2021: Mortality with Meep: Digging into CDC report on mortality in the first half of 2020 – discusses cohort v period life expectancy
- Jun 2021: Mortality with Meep: U.S. Life Expectancy Fell 2.4% in 2020, and Death Rates Increased 16.1%
- Apr 2022: 2021 U.S. Mortality News Explainer: Life Expectancy, Death Rates, and More
2020-2021 Mortality Experience Posts
By Age Groups
Children — Age 1-17: Childhood Mortality Trends, 1999-2021 (provisional), Ages 1-17 Revisited: Teen Mortality Increased 30% 2019 to 2021 Under age 1 is infant mortality and requires special handling — I really don’t want to deal with this right now.
Young Adults — Age 18-39: approximately the Millennials in 2020-2021 Part 1 and Part 2, plus the podcast
Middle Agers — Age 40-59: approximately Gen X – Middle-aged Massacre (too!): Increase in Mortality for Ages 40-59 in the U.S. for 2020-2021 Mainly Driven By COVID
Young Seniors — Age 60-79: approximately Boomers – Baby Boomer Mortality Experience: Welcome to Old Age! 2020-2021 U.S. Mortality Increase for Ages 60-79 was Mostly COVID
Old Seniors — Age 80+: mainly Silent Generation (as older generations are mostly dead at this point) – Silent Generation Has Odd 2021: COVID Over 100% of 2021 Mortality Increase Compared to 2019 in the U.S. for those over age 85
By Cause of Death
Top Causes
Top Causes of Death in U.S. for 2021 by Age Group
Top Causes of Death for 2021: Heart Disease, Cancer, and COVID
Suicide
Suicide: Trends, 1968-2020, and Provisional Counts Through June 2021 – this one had only one standalone post, but I’m not done with this topic yet.
Mortality Nuggets: Videos on Suicide Rate Trends, Society of Actuaries Report, and Fixing Their Graph — there are a variety of mortality trends covered in video form here, and suicide rate trends are in the first video.
Homicide
Homicide: Trends, 1968-2020, and Provisional Counts Through June 2021
The Geography of Homicide — States, Base Rates, Increases, and Correlations
Motor vehicle accidents
Motor Vehicle Accident Deaths: High-Level Trends, 1968-2020, Part 1
Motor Vehicle Accident Deaths, Part 2: Age-Related Trends with Provisional Results in 2021
Motor Vehicle Accident Deaths, Part 3: Geographical Differences, 2019 vs 2020
Drug overdose deaths
Drug Overdoses, Part 1: High-Level Trends, 1999-2020
Drug Overdose Deaths, Part 2: U.S. Age-Related Trends 1999-2020 with Provisional Results in 2021
Drug Overdose Deaths, Part 3: Geographical Differences for 2019 and 2020
Alcohol-related deaths
Part 1: Dead is dead: Increased Alcohol-Related Deaths, U.S., 2020-2021
Part 2: Alcohol-related deaths, part 2: Geographical Differences for 2019 and 2020
