Update: Why Have "Full Contributors" Lost So Much Ground In Twenty Years in Public Pensions?
by meep
Back in 2017, I asked a question: Public Pensions: Why Do 100% Required Contribution Payers Have Decreasing Fundedness?
Well, it’s 6 years later, and the situation is no better.
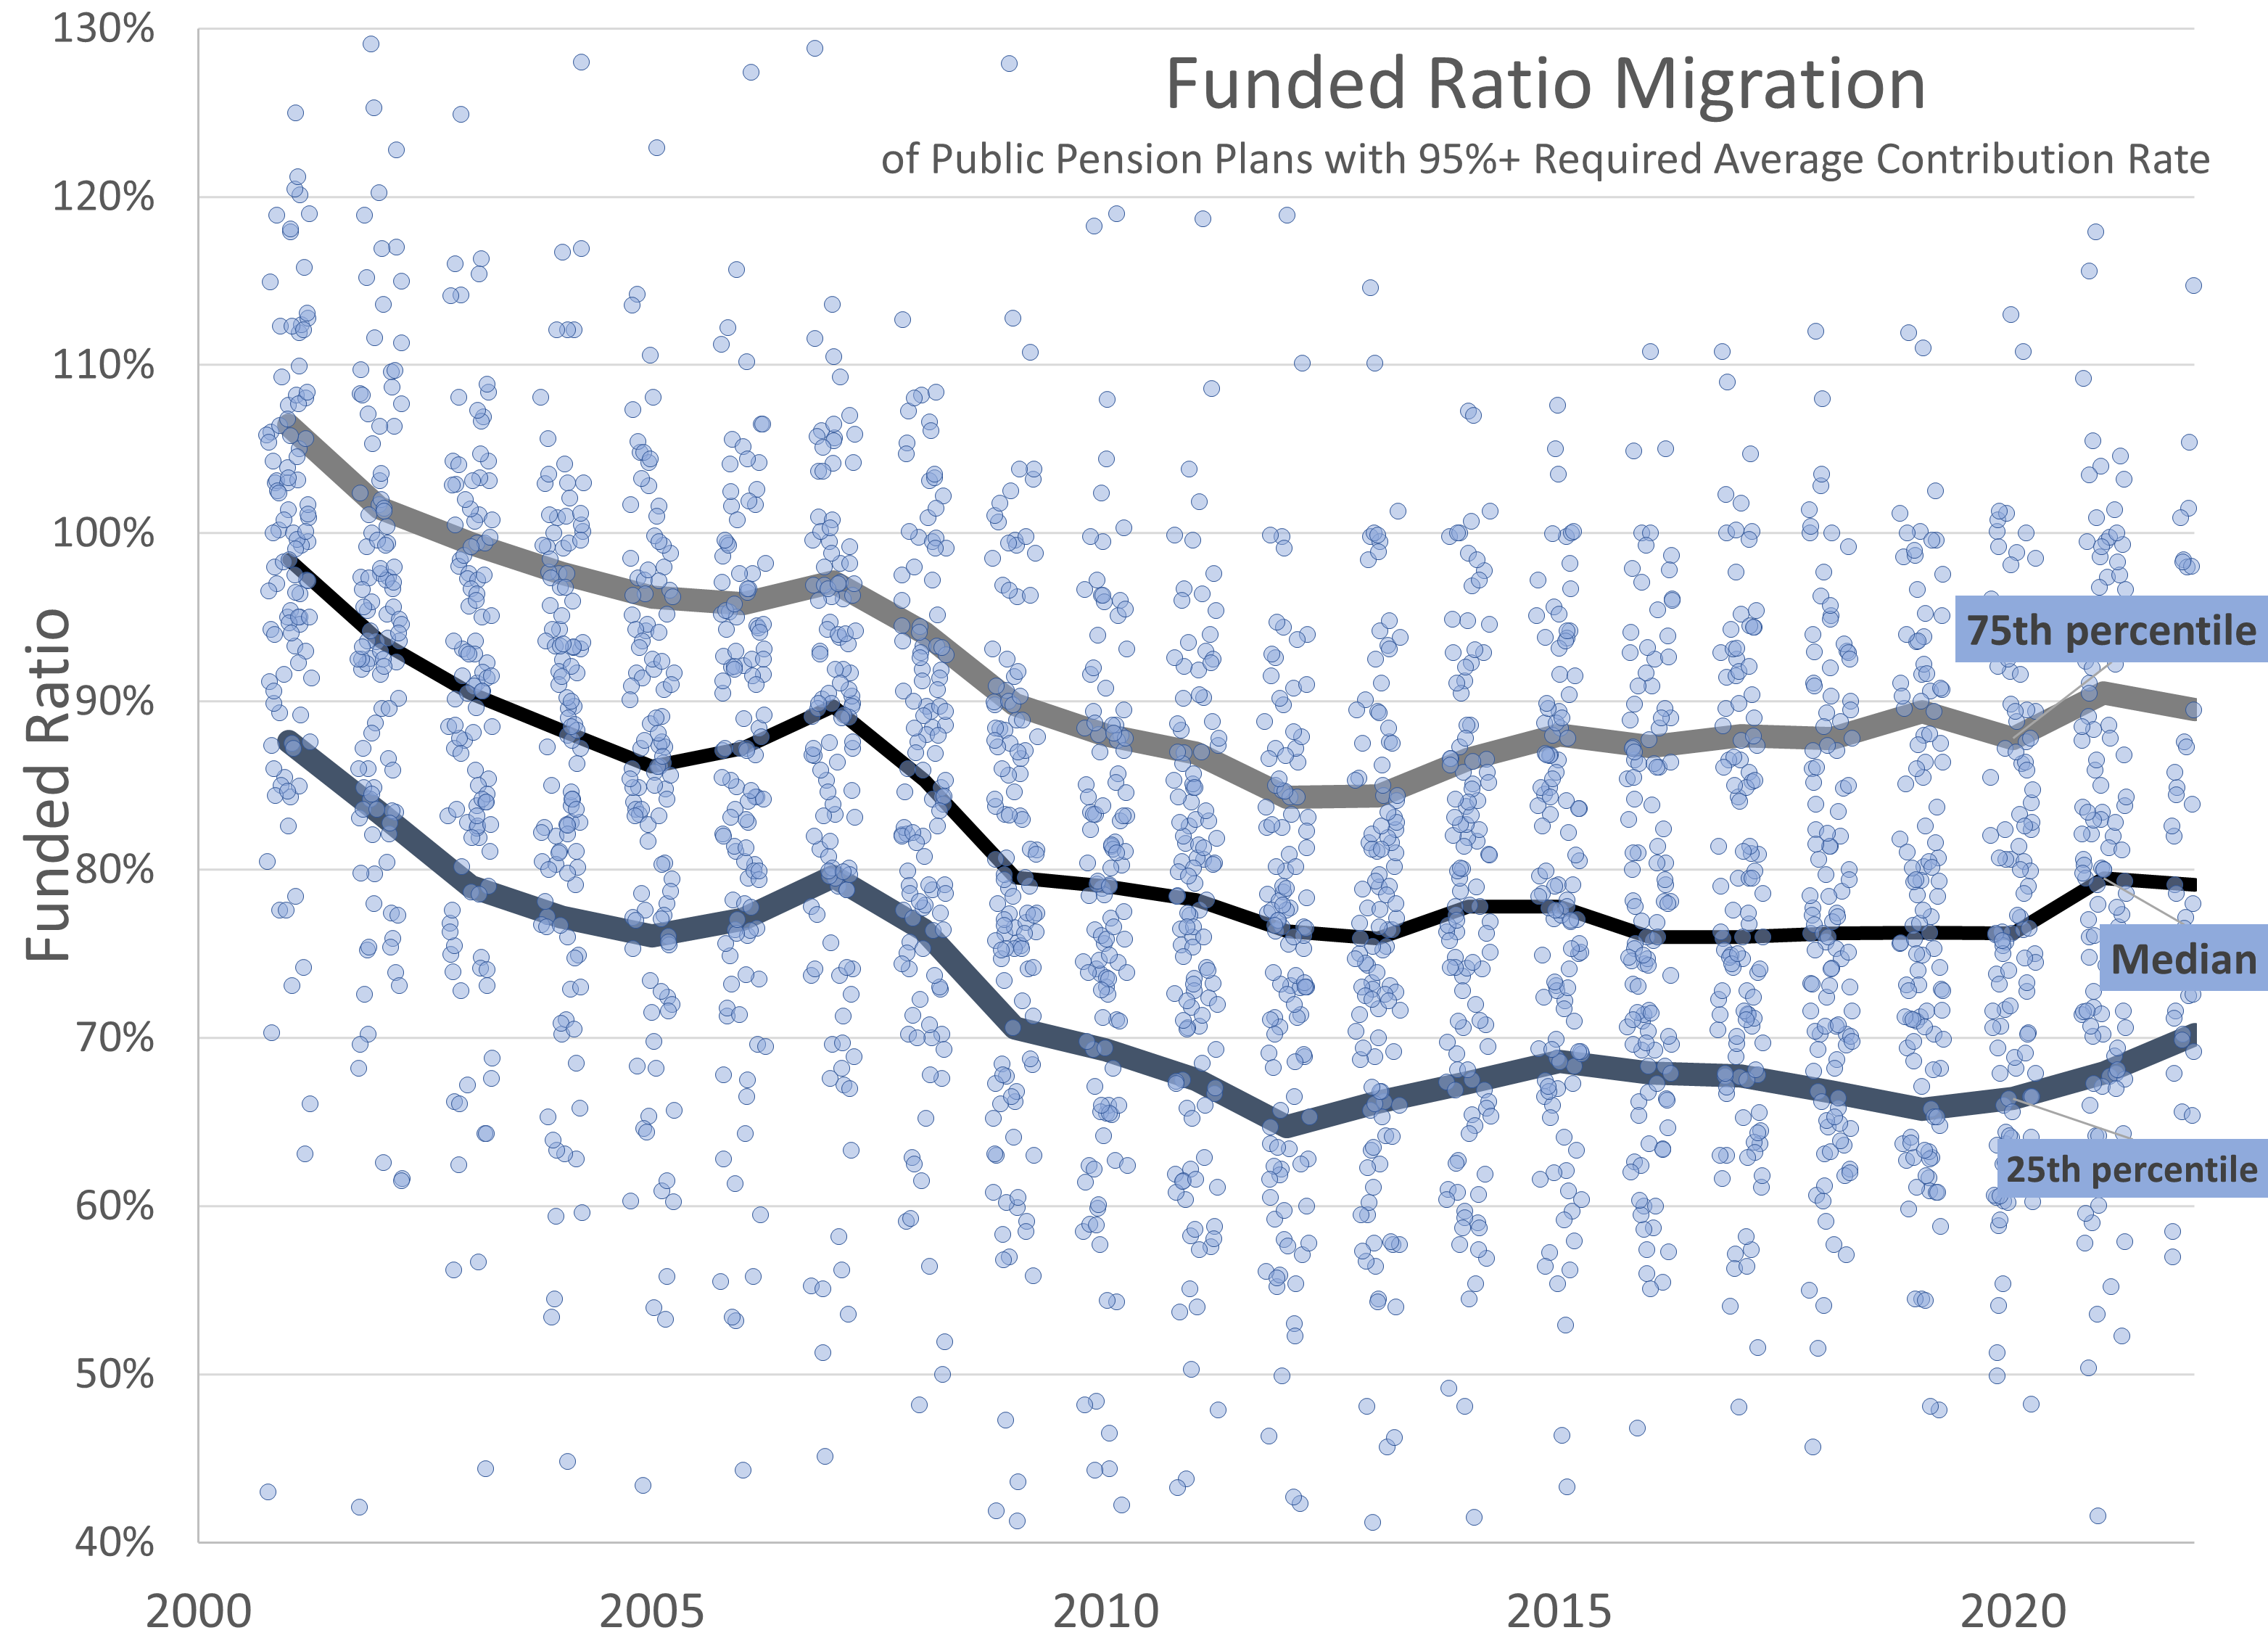
The data, as per usual, come from the Public Plans Database. So as not to be too restrictive (otherwise, I would have had only 38 plans to plot), I chose plans that averaged contributing at least 95% of their “required” contribution each year (through 2021, as many plans didn’t have fiscal year 2022 reported.) This gave me 119 plans to work with.
As you can see, the plans started out with the median near 100% fundedness in fiscal year 2001.
The median had traveled down to 80% post-great recession in 2010… and it’s been just hanging out down there since then.
Even though there had been a very long bull run post-2010 (until the recent unpleasantness), the public pension funds just never seemed to climb up to full-fundedness again. Even though they were making full “required” contributions.
Why?
Why no appreciable progress?
Snapshot of three plans
Let me pick out three plans with three different trajectories: Calpers, IMRF, and New York State and Local ERS.
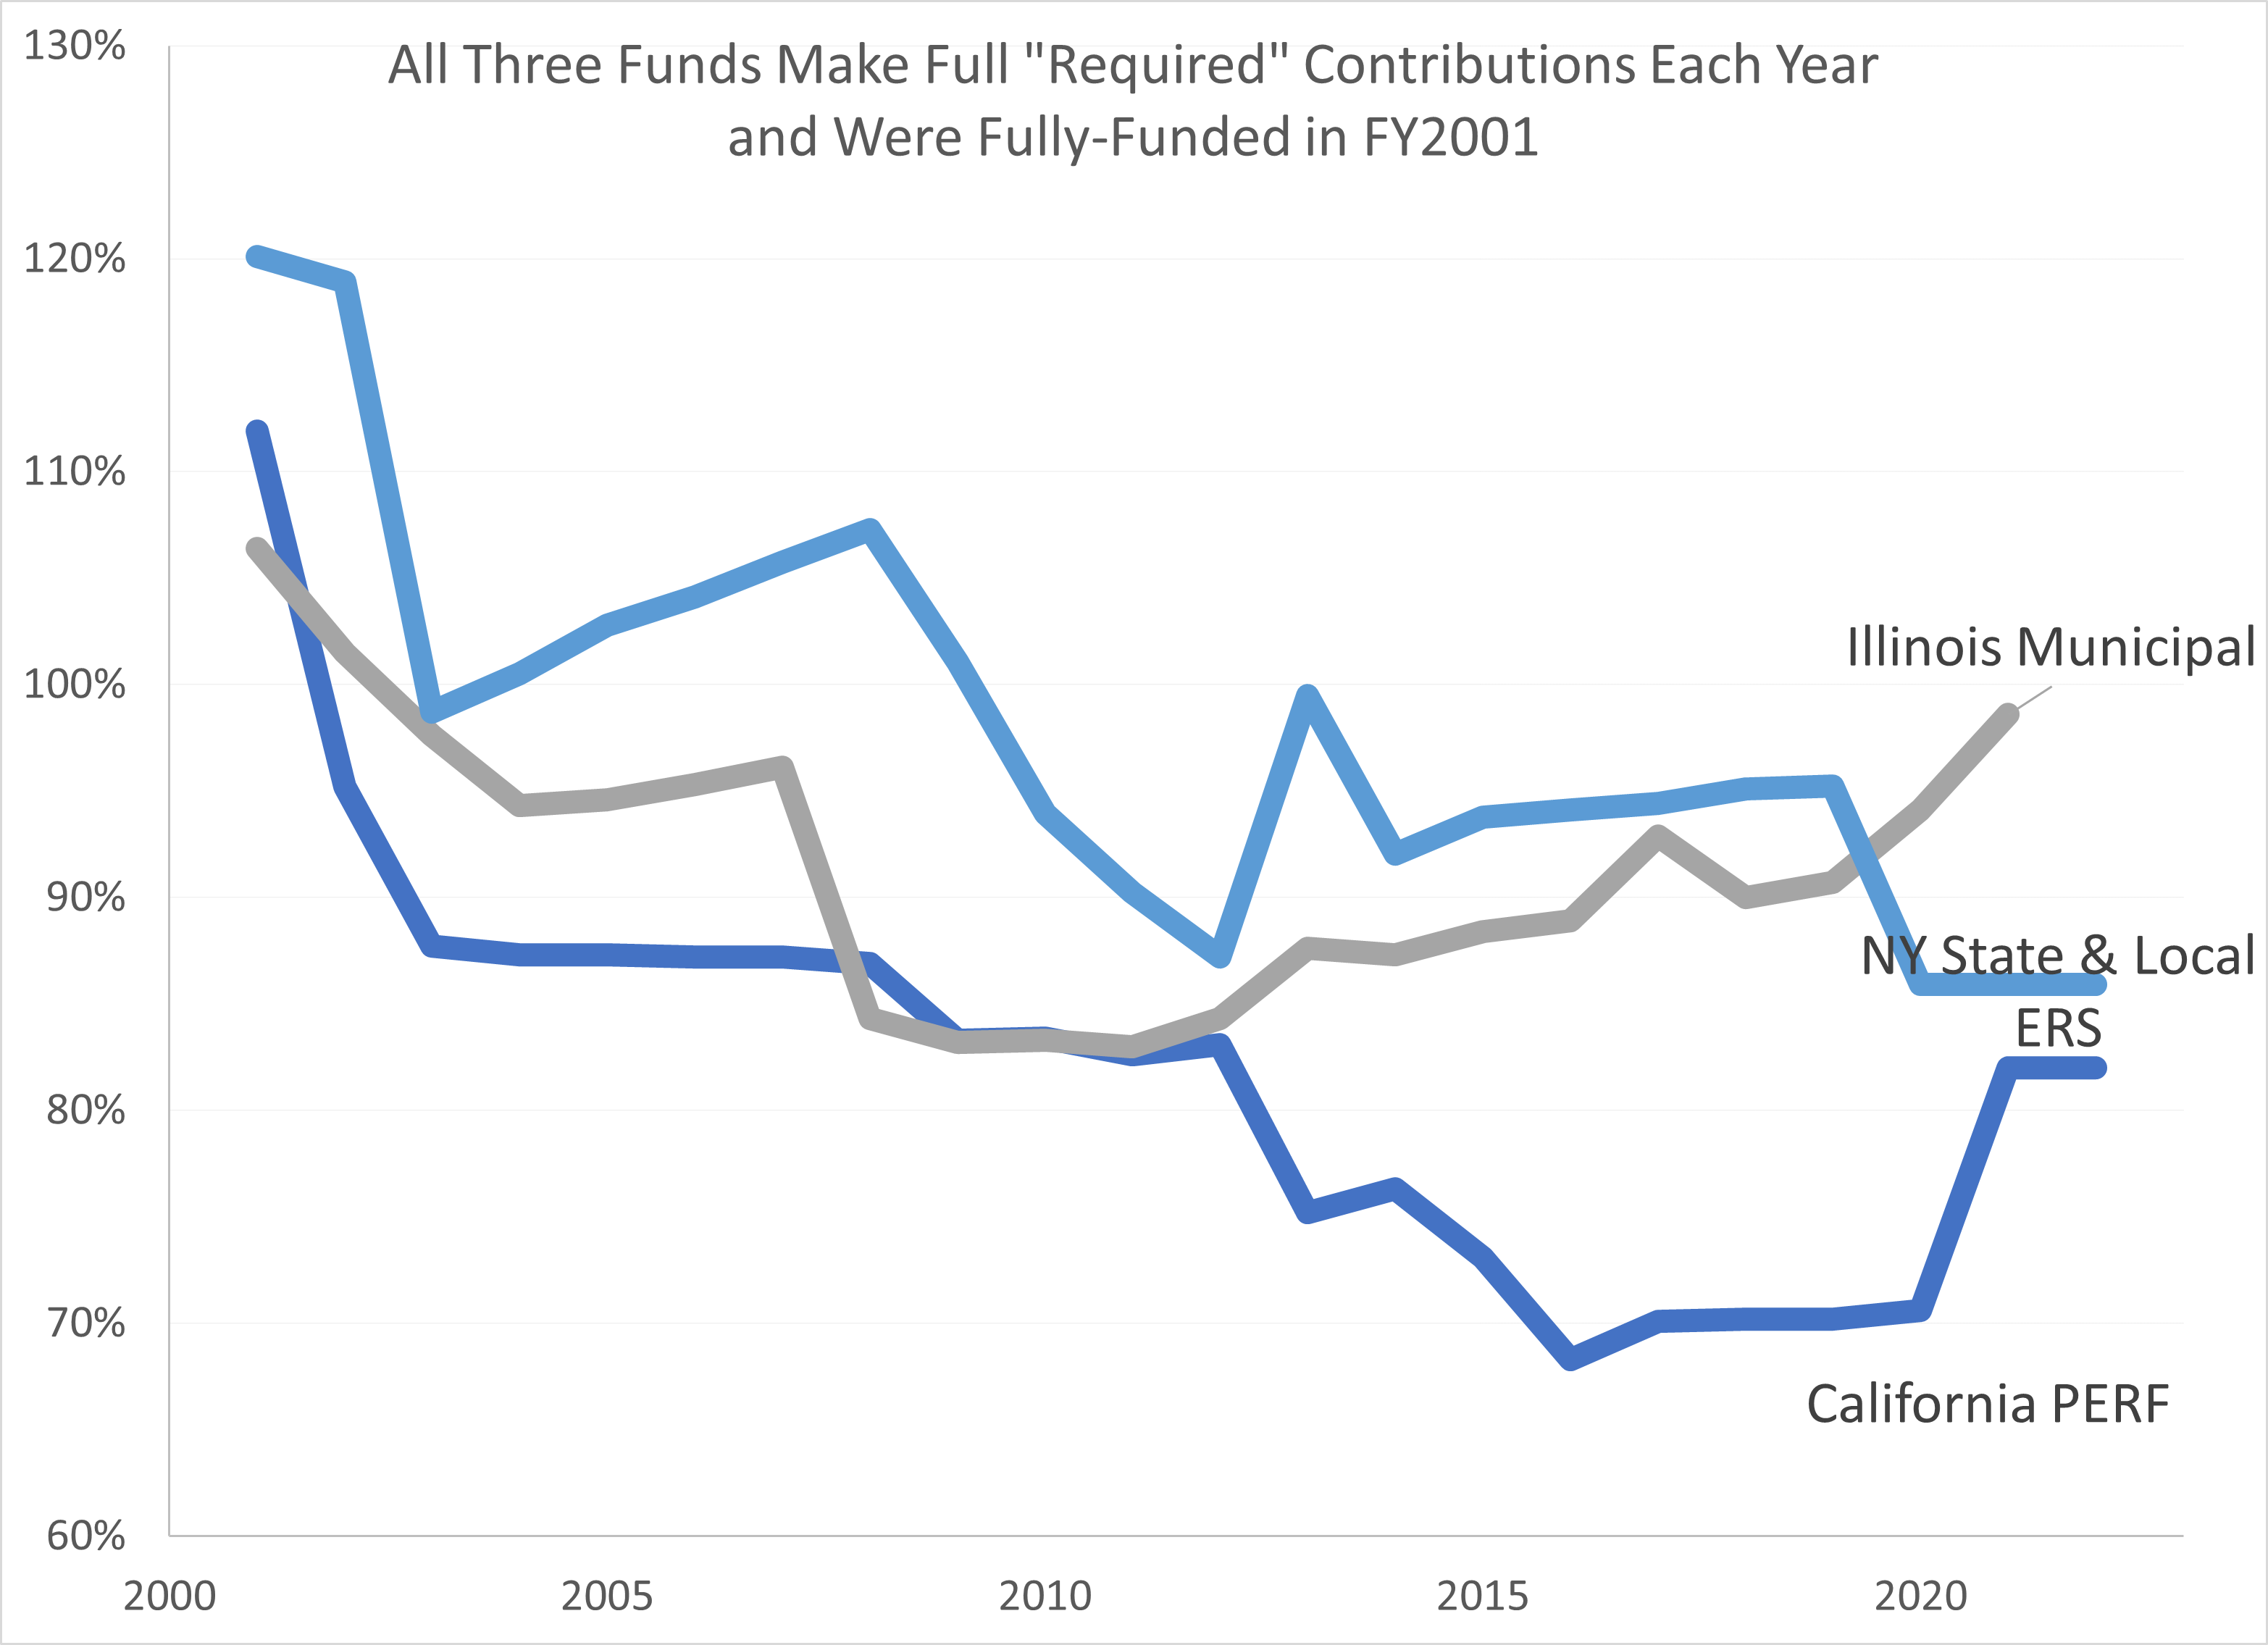
I picked these three because they’re somewhat similar in terms of how they operate. They’re statewide funds, operated in a centralized manner.
Local government organizations are forced to make required contributions. They actually are required to contribute.
So these three make 100% contributions each year — no more, no less.
And yet.
Look at those trajectories.
Investment returns?
You could blame differences in investment returns… that’s possible.
Calpers most recent annualized 10-year return was 7.7% for 2022, and 8.5% for 2021.
IMRF had 10.7% in 2021.
NY State & Local ERS had 9.6% for 2022, and 9.2% for 2021.
These are long-term averages, and small differences over long periods make large differences.
But these returns are all above the assumed return on assets. You should be seeing improved funded ratios.
It can’t simply be the investment returns.
Other issues
There has been a real focus on interest rates/assume investment returns because that’s the biggest lever.
Pretty soon we’ll be seeing some pretty big numbers being reported in actuarial reports because they’ll be forced to. Various industry groups are prepping the various interested parties in methods to explain these big numbers away. I will write about that later.
But there are loads of assumptions that go into determining the calculation of the “required” contribution amounts.
(and if you are wondering why I keep putting scare quotes around required here… but not for Calpers, IMRF, and NY State & Local ERS — it’s because, for most public pension plans, there is nothing that makes the sponsoring employer actually contribute the amounts. They could put nothing into the fund. There are no guarantees and no requirements, unlike with ERISA, which covers private plans.)
A lot of the problem is that the “required” contributions are calculated using assumptions like the payroll will grow, and we will be making payments as a percentage of payroll, so we can pay less now as we will be paying more later! (But that ends up not happening)
One of the things I’m not showing in the above graphs is the pattern of payments being made. Because for most of these plans, it’s grown a lot.
They are having to pay a lot more money just to keep funded ratios in place, barely.
Can this keep up?
I had been somewhat confused by the deflating funded ratios in the aggregate during the bull run. Why weren’t things budging?

I have been sitting looking forlornly at those sub-80% funded ratios (especially when so many were sub-70%), because I have been hoping to revive my 80% hall of shame. I do check my news alerts, but it’s about stuff like something about surveys of 80% of retirees in Manila or something like that.
It’s nothing but tumbleweeds while I keep hoping for underfunded pensions trying to pretend everything is just fine and dandy. Like this sort of crap.
But part of the reason I had been hoping to see these ratios increase appreciably is that I’ve been expecting the next recession… and they’re going to be taking another hit.
Unless people are ready to see pensions get reduced (again, in some cases), it’s not great that many of these plans are not back to fully-funded at they were in 2001.
Some are — but the reasons some are not? It’s those “required” contributions are calculated in a way to put off costs into the future to make up for losses…. and the future is now.
There is no reason to assume that it becomes easier to make up for those losses later.
And we run out of time.
Related Posts
The California Rule Court Case: What Can Be Changed on Public Pensions?
Stupid Public Pension Trends: Divestment Expands
Kentucky Pensions Even Closer to the Brink: New Assumptions, New Report
