Public Pension Returns: Can Public Pensions Beat the Market?
by meep
The reason I ask that question is that we have this:
As well as this article:
Between a rock and a hard place
Dismal returns, poor projections push public plans to pare investment gain expectationsAs public pension plans disclose a second consecutive fiscal year of lackluster returns, amid projections of diminished investment earnings for the next decade, more public asset owners will have little choice but to lower rate of return expectations, consultants and analysts said.
U.S. public pension plans earned a median return of 1.07% in the fiscal year ended June 30, according to the Wilshire Trust Universe Comparison Service, worse than the median 3.43% in the prior fiscal year. It is the second year in a row that returns were nearly flat and well below the yearly 7.5% return target of many plans.
“I think they have to lower their rate of return; and if you look at the trend, that is what has, in fact, been happening,” said Allan Emkin, whose firm, Pension Consulting Alliance, consults for some of the largest defined benefit plans in the U.S., including the $303.3 billion California Public Employees’ Retirement System and the $188.7 billion California State Teachers’ Retirement System.
“There are unprecedented headwinds: the lowest historic rates of return in the bond market, and risk assets are all fully priced,” said Mr. Emkin, co-founder and managing director at PCA in Los Angeles.
“It’s really difficult to see how historic rates of return will be replicated in the next 10 years,” he said.
The investment performance of the past 30 years reflected a “golden era” that won’t likely be repeated, said Sree Ramaswamy, a Washington-based senior fellow at the McKinsey Global Institute. He projects that total returns for U.S equities over the next 20 years could average 4% to 5%, because of slowing GDP growth and increased competition from abroad, roughly 250 basis points below the average from 1985 to 2014.
One challenge for pension plans is the assumed inflation rate, which is factored into expected rates of return, and the question of whether plans have reduced those assumptions enough to account for what economists believe will be a long-term, low-rate inflation environment. Another issue: Most public pension plans are paying out more in benefits than they take in from contributions and investment income in a given year, meaning they have to sell assets to pay retirees, a problematic answer when markets are struggling.
Average returns of only 4 – 5% for decades would be a kick in the teeth, wouldn’t it? Especially if you’re wanting to discount at 7%?
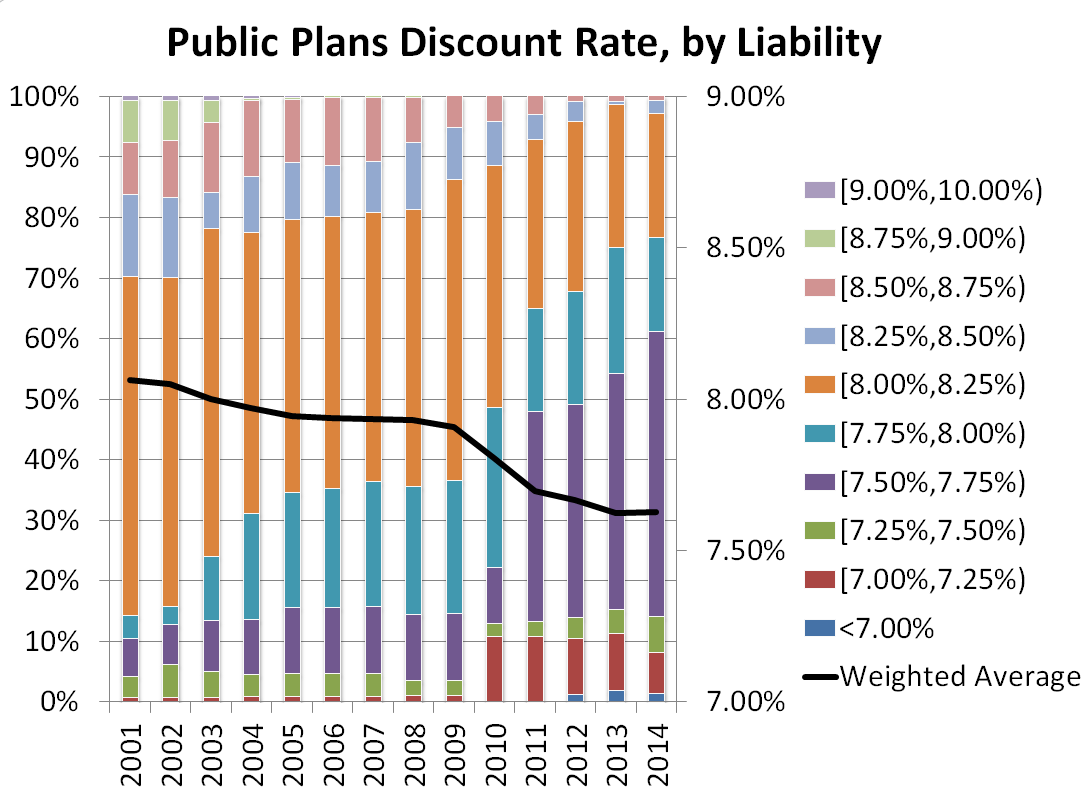
I’ve seen expected rates well under 7% before with respect to public pensions. From prior posts on Illinois state pensions, which have a common investment fund, we saw the following table:
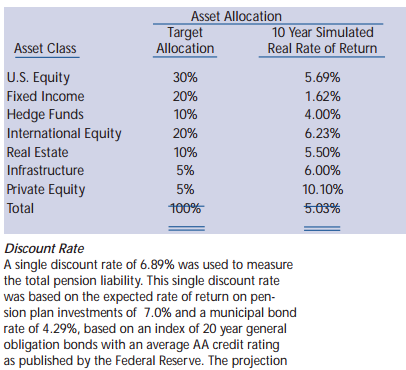
5% expected real rate of return, eh?
So why do pensions think they can beat that by 2 full percentage points or more?
ACTUAL EXPERIENCE OF PUBLIC PENSIONS
From my prior post on measuring average returns, we see the public plans databse gives us geometric averages for the performance.
So let’s see how these plans have actually done with their assets! I picked fiscal year 2014, as that’s the most complete year for the largest number of plans — and I filtered out the plans with 0% average returns since 2001, because that’s probably due to missing data.
Here’s a graph of assets versus average returns. I measured assets on a logarithmic scale, because that’s what one does when the largest funds are super large, in terms of orders of magnitude larger than the smaller plans.

A few observations I want to make:
- There is wide disparity in the performance of the smaller pension plans. Up to about $10 billion in assets, there a wide spread.
- Once we start getting into plans greater than $10 billion, we see that the variability in plans results shrink down to something south of 6%.
- The point all the way to the right is Calpers, in case you were wondering.
Now, this is just a specific 14-fiscal-year interval for these plans that we’re looking at. One would hope this is just a small slice of their lifetimes as pensions, and thus perhaps there will be recovery past 2014, the last two years of sideways markets notwithstanding.
HISTORICAL RETURNS
The following article is intended for individual investors — when an individual is in retirement, they’re unlikely to be receiving outside funds to add to their retirement pool of funds, so this is a little different from a group pension plan.
Still, check out this historical info:
This is why you can’t draw 4pc from your pension each year and expect it to last
…..
We have grown up listening to investment epithets such as “shares always outperform cash over time” and many of us even have a vague figure in our minds, say 8pc, for the annual returns you might reliably expect from shares “over time”.Insurance companies encouraged this complacency by sending out millions of investment projections based on fanciful (and overgenerous) guesses at future returns.
The reality is far less reassuring. A typical mixed portfolio, of 30pc bonds and the remainder in shares, has indeed returned an average 8.4pc per year over the past 116 years.
But within that long period there were such extremes of returns that entire generations of investors saw their fortunes made or blighted.
…..
What this huge dispersion of returns makes clear is that averages obtained over long periods, and investment methodologies based upon those averages, are not reliable.It is not very helpful for example to learn that a mixed portfolio returns 8.4pc per year if you own such a portfolio for 20 years and get just half of that. And something similar applies to the often-quoted “rule of 4pc”.
The basis of this yardstick, developed in America in the early Nineties by financial planner and statistician Bill Benger, was that if you drew 4pc annually out of a portfolio invested 50:50 in shares and bonds, in no circumstances going back over market data between 1926 and 1976 would your cash run out within a 30‑year retirement.
The theory has attracted much fascinated study, criticism and support ever since.
Subsequent testing of the rule using more recent market returns, or using data from stock markets other than the US, suggests the figure should be far lower.
The above data are from U.S. markets, I believe. Oh, and here’s the graph:

Maybe those income annuities aren’t looking so bad now, are they? Just think about it.
I will be getting back to this stock market volaility in a post later this week. It has so many effects, you may not realize it.
But let’s think about that narrowing funnel of large funds — why aren’t they performing better than small funds?
LARGEST PENSIONS NOT LIKELY TO OUTPERFORM
Let’s go to the world of hedge funds first.
A few years ago, someone determined the ‘ideal’ hedge fund size:
Apparently There’s A ‘Goldilocks’ Hedge Fund Size
Apparently hedge funds of a certain size are best at getting the market ‘juuuuust right.’
Hedge funds with assets under management of $100-499 million and $500-999 million beat their bigger brethren in terms of 12-month average returns in 2013, says a report by Preqin, a researcher.
The mid-sized firm groups had average 12-month returns of 13.79% and 13.71%, respectively.
Big hedge funds — or as Preqin classifies them, funds with $1-5 billion — posted 12 month average returns of 12.08%.
Now that’s just a one-year result.
What was the total market return for 2013, by the way? Over 33% for the S&P 500.
Those hedge funds aren’t sounding so great now, are they?
Now, I could start pulling out the philosophy of the Efficient Market Hypothesis and alpha and all that jazz (an aside, I have a meep’s form of the EMH — I, meep, cannot beat the market…so I don’t try).
But let’s get down to the nitty-gritty: it is very, very tough to get outsize returns on a huge amount of assets — once your funds get large enough, you’re essentially the market.
Calpers has over 300 billion dollars in assets. That larger than any single hedge fund. and about 10% of all hedge fund assets under management.
It’s really really big.
Which reminds me.
If MetLife is argued to be a Systemically Important Financial Institution, at $900 billion in assets, might Calpers be a SIFI?
Just something to think about.
Related Posts
Kentucky County Pensions: 60 Percent Fundedness and Decreasing is Awful
Divestment and Activist Investing Follies: What's Next? My Lunch?
Arguing against the Public Pensions "Truths" and "Myths"
