Mortality Monday: How High Can Omega Go?
by meep
For those not in the know, the omega of a mortality table is the maximum age for a given table. If any of your population has survived up to omega, you assume that they drop dead at that point.
Omega generally has been set well above life expectancy. Most current standard tables, such as the ones from Social Security, set omega at 120.
In recent history, there’s been only one person verified to have lived past age 120. So it’s not necessarily bad to use as an omega.
I used to use tables where omega was set at 140.
Mind you, just because we have entries going up to omega with non-zero survival, it is pretty-damn-close-to-zero survival.
If I pick the farthest-projected mortality table from that Social Security study, for birth cohort 2100, they project 34 out of 100,000 males would make it to age 120 and 74 out of 100,000 females.
That’s 0.034% and 0.074% chances, respectively. And that was assuming certain mortality improvements which may not appear. But that’s for a different post.
If I use projected mortality for people currently living, such as the 1970 cohort table, you’ll see fewer than 1 out of 100,000 making it to 120 — that’s less than 0.001% chance.
NO LIMIT TO HUMAN LIFE?
With that in mind, consider this recent research: There’s no limit to how long we could extend our lives, say researchers
The scientific team of biotech company Gero recently published a study in the Journal of Theoretical Biology that debunks a long-held misconception regarding two parameters of the Gompertz mortality law — a mortality model that represents human death as the sum of two components that exponentially increases with age. The Gero team studied what’s called the Strehler-Mildvan (SM) correlation and found no real biological reasoning behind it, despite having been held true for more than a half a century now.
The SM correlation, derived from the Strehler-Mildvan general theory of aging and mortality, is a mechanism-based explanation of Gompertz law. Specifically, the SM correlation uses two Gompertz coefficients called the Mortality Rate Doubling Time (MRDT) and Initial Mortality Rate (IMR). Popularized in the 1960s in a paper published in Science, the SM correlation suggests that reducing mortality rate through any intervention at a young age could lower the MRDT, thus accelerating aging. As such, the hypothesis disrupts the development of any anti-aging therapy, effectively making optimal aging treatments impossible.
The Gero team, however, realized that the SM correlation is a flawed assumption. Instead of using machine learning techniques for anti-aging therapy design, the researchers relied on an evidence-based science approach. Peter Fedichev and his team tried to determine the physical processes behind the SM correlation. In doing so, they realized the fundamental discrepancy between analytical considerations and the possibility of SM correlation. “We worked through the entire life histories of thousands of C. elegans that were genetically identical, and the results showed that this correlation was indeed a pure fitting artifact,” Fedichev said in a press release.
Human life extension
Other studies have questioned the validity of the SM correlation, but in their published study, Fedichev and his team were able to show how the SM correlation arises naturally as “a degenerate manifold of Gompertz fit.” This suggests that, instead of understanding SM correlation as a biological fact, it is really an artifactual property of the fit.
Sometimes people over-interpret their models. This is one such case.
Here’s the academic paper: Strehler-Mildvan correlation is a degenerate manifold of Gompertz fit
I want to pull out this particular highlight:
As far as Gompertz law adequately describes mortality, the linear Strehler-Mildvan correlation is observed only in experiments with a modest change in lifespan and breaks down for dramatic lifespan changes.
Now, these researchers are not saying that humans can live for any arbitrary amount of time… but they’re saying that the S-M correlation is not a law, just something that works pretty well for minor changes in lifespan.
How long have we got mortality data we can rely on? Not very long:
Human demography evolves rather slowly and therefore for sufficiently short time-periods any human population can be considered homogeneous with a constant lifespan. Therefore, we expect that there should exist an approximate form of SM correlation.
Okay, that’s boring. Have a graph:

That’s Swedish mortality, iirc.
Let me make my own log-linear graph with Social Security mortality tables:
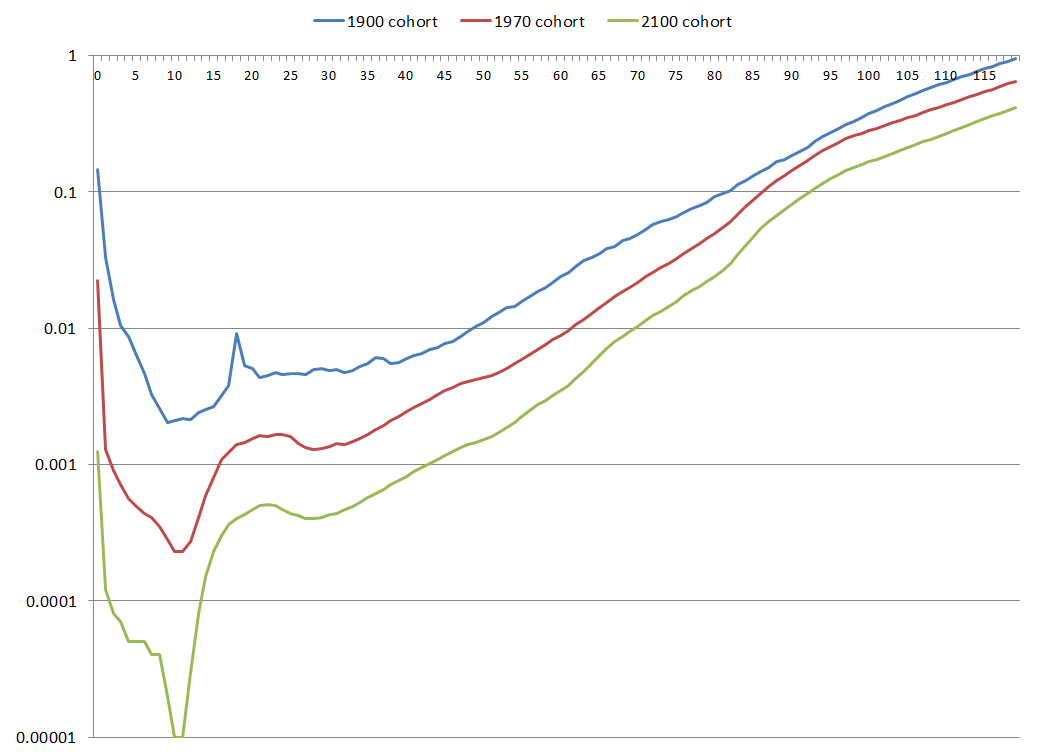
=squint= I gueeeesss it can look kind of linear there.
Especially since those linear parts are already projected for the 1970 & 2100 cohorts.
In any case, the point is that just because a math model fits a certain data set, you need to realize that if there are limitations to the data set, you may get the illusion of a “law” where it’s really just that things aren’t changing all that much over the time period you’re looking at.
It’s like trying to project 50 years of interest rates based on one year’s movements. Or doing a linear fit when one of the dimensions is really restricted.
Okay, let’s have Freddy take us out for this post…
