Pennsylvania Pension Trends: Assets
by meep
As mentioned recently, Pennsylvania passed a ho-hum “reform” lately, so let’s see just how bad Pennsylvania pensions look.
If you go to the Public Plans Database page for Pennsylvania, there are four plans listed:
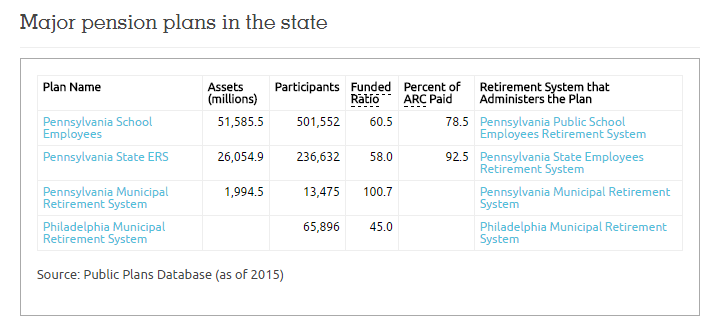
As you can see, info for the fourth one is incomplete, and the third is so much smaller than the other two (and the fourth with missing info), so I will concentrate just on those two largest plans:
While these two have similar funded ratios, we’ll see that their assets are a bit different.
ASSET AMOUNTS OVER TIME
I believe these plots are of estimated market value of the assets:

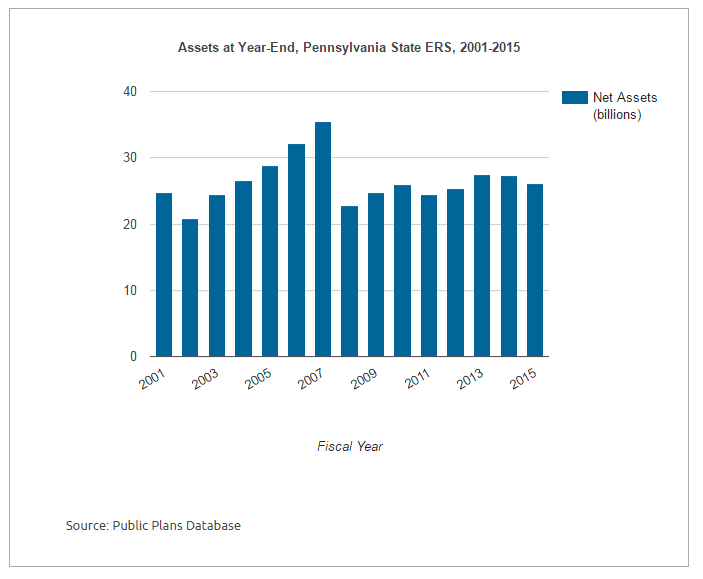
They have the same sort of pattern – peak in 2007, crash in 2008, and struggling to increase since then.
Let me explain my “estimated market value” qualification above. There are two parts to it.
First, this is to distinguish the “actuarial value” of assets. The actuarial value of assets are used to calculate funded ratio and ARCs (actuarially required contributions). Usually, actuarial assets are “smoothed” so that a big hit like what we see in 2008 doesn’t distort funding policy too much.
That’s the theory at any rate. When we get to my post on liabilities, we will see what this smoothing hath wrought.
Second, the composition of these assets are such that many of them are difficult to value. So you have to estimate the value. This can lead to “surprise” losses when these particular assets get sold or run out (if these are cash-generating assets with a designated lifetime.)
ASSET ALLOCATION
We will see how this is important. First, I’m going to put up pie charts of the fiscal year 2015 asset allocations for these two plans.
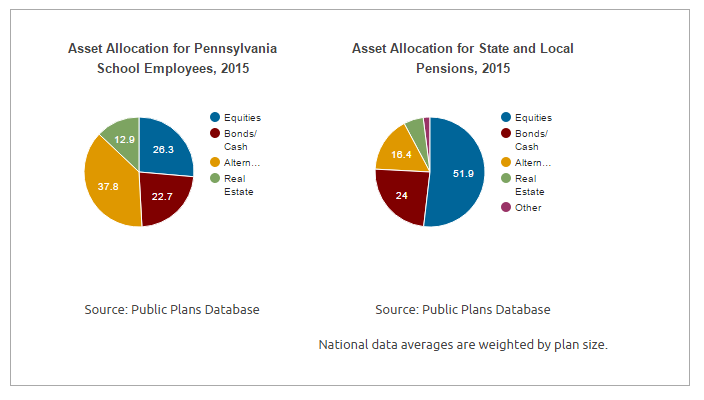

I hate pie charts. But I know some will find those a useful snapshot (I don’t.) The comparison numbers differ, because the Public Plans Database compares against “peers”, which relates to the size of the pension plan. The School plan is twice the size of the State ERS plan.
NOTE: The superhigh allocation to alternative assets. Those are what the “estimated market value” are for.
Let’s look at the asset allocation history. When did that allocation become so high?
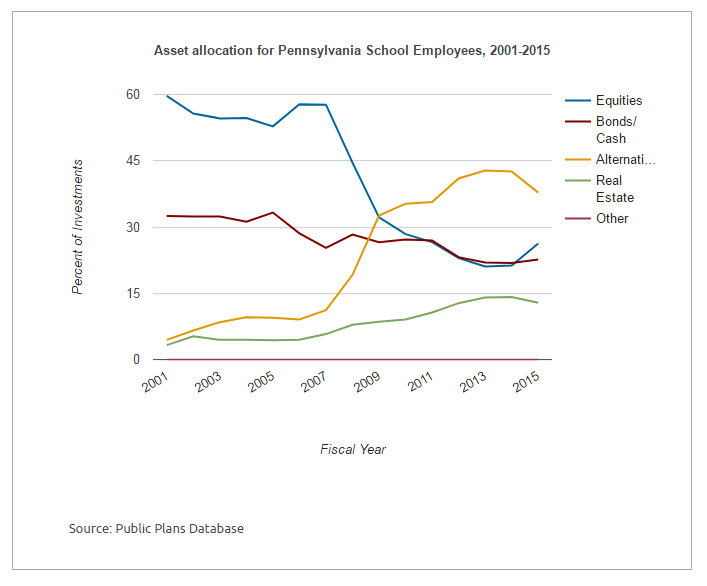

Look at that. The allocation popped right up in 2009. Right after the big losses in the stock market. The State ERS trend is not quite so steady, but we can see that after the big asset loss, there was a shifting into alternatives.
INVESTMENT RESULTS
The reason for alternative assets, supposedly, is to get better returns. Given the asset allocation shift, one assumes the 5-year return should show higher performance than the 10-year return (which includes the 2008 drop).

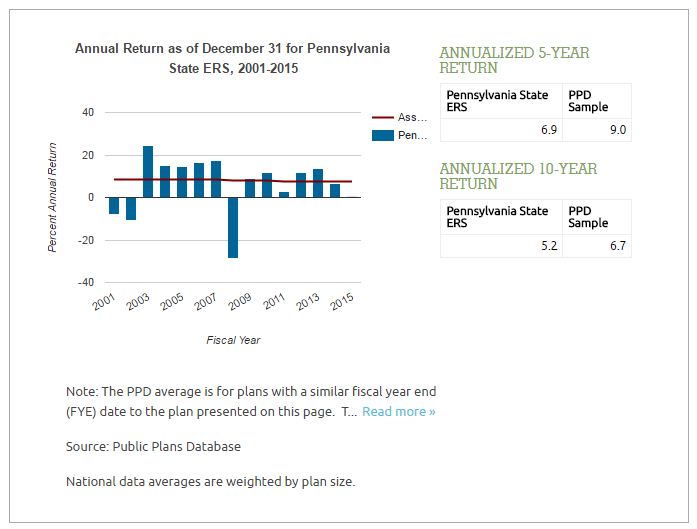
While the within-plan comparison, that holds, take a look at how they perform against peers: around one full percentage point less. Over the long term, that poor investment performance adds up.
Might the high allocation to alternatives be at fault?
THE FEES ARE TOO DAMN HIGH
The Pennsylvania folks claim that yes, the alternatives are at fault, and not because of the inherent problems with pensions investing in a lot of alternatives, but because of the investment fees.
It’s tough managing a $51.3 billion pension fund that pays $6.3 billion annually to 225,000 retirees, and making sure there will be enough to secure the benefits that another 257,000 workers are entitled to when they retire.
Especially when you only have about 57 percent of the money needed for the job.
That’s the task of Pennsylvania’s Public School Employees’ Retirement System, or PSERS, which has come under scrutiny for the amount of money it is spending on investment managers.
Pennsylvania Auditor General Eugene DePasquale recently took the pension fund to task for spending more than $416 million on investment managers last year. He called the expense “woefully unfair” to taxpayers and the retirees and employees who rely on the underfunded pension plan.
“It is mind-numbing that they want a pat on the back for reducing the fees from $441 million in 2015,” Mr. DePasquale said in a statement to the press.
PSERS termed Mr. DePasquale’s claim “baseless and inconsistent.” The pension fund said the top-tier advisers it hires have produced top-tier results. Over the last 17 years, that has meant an additional $12.1 billion in earnings over what less expensive managers would have generated, the retirement system said.
A great deal of the expense issue centers on PSERS’ reliance on “alternative investments,” such as private equity, hedge funds and commodities. Alternative investment managers typically charge higher fees than active investment managers who pick stocks and bonds, and a lot higher fees than passive managers, who invest in the S&P 500 and other indexes.
Large state pension funds jumped on the alternative investment bandwagon over the last 10 years in a quest for larger returns, to diversify and manage risk, said Greg Mennis, who specializes in public sector pension plans for the Pew Charitable Trusts.
The nonprofit research group’s recent report indicates few public pension plans embraced alternatives with more enthusiasm than PSERS and Pennsylvania’s State Employees’ Retirement System, or SERS, a nearly $27 billion fund with about 237,000 members.
The nonprofit research group said PSERS allocated 53 percent of its investment money to alternative investments in 2014, topped only by the 56 percent that Arizona’s public safety employees pension plan allocated to that category.
…..
The 41 funds that reported returns on an after-fees basis generated an average 10-year return of 6.59 percent as of 2015, according to Pew. Pennsylvania’s Public School Employees’ Retirement System’s 10-year return was 6.31 percent while the State Employees’ Retirement System generated only 5.2 percent, the research group found.
I rate the bolded:

I guess it depends on who you’re comparing against.
Something tucked in one of the stories on the pension reform:
Gov. Wolf, who vetoed a 2015 GOP pension bill that he deemed unfair, said one key element of the current bill is a push to cut Wall Street investment fees by $3 billion over three decades. Pennsylvania has the fifth-highest fee levels of any state, according to Pew.
I will be getting to the Pew study on investment fees in a later post. We’ll see whose fees are even higher then.
But let’s think — $3 billion over three decades:
1. Is that a present value calculation (if so, probably with a discount rate of 0%)
2. That’s just $100 million per year. According to my data, in FY 2015, the state put in $1.7 billion to the state employees plan and $3.6 billion into the schools plan.
I’m comparing cash flow to cash flow, and not against assets under management. $100 million compared to the $5.3 billion contribution is 2%. Every little bit helps, but it’s going to be helping a very little bit.
One last item on the fees: Pennsylvania Watchdog Slams ‘Unfair’ Pension Fees
Pennsylvania’s Auditor General has lambasted the state’s Public School Employees’ Retirement System (PSERS) for paying fees that were “woefully unfair to taxpayers and PSERS members.”
The findings come from Auditor General Eugene DePasquale’s recently released 151-page audit report of PSERS, which covers July 1, 2013, to March 31, 2017.
“One of my most significant concerns from this audit is that PSERS doesn’t seem to think spending more than $416 million on investment management fees in 2016 is a big deal,” he said. “It is mind-numbing that they want a pat on the back for reducing the fees from $441 million in 2015.
In 2000, PSERS was overfunded by 24% and remained above 100% funded until 2003, according to the auditor general’s office. As of June 30, 2016, PSERS was down to 57.3% funded with an unfunded liability of $43 billion, and invested assets of $49.2 billion.
“There should be a never-ending focus on driving the fees paid by PSERS to the absolute lowest level possible,” DePasquale said, noting, “Every investment fee dollar saved remains in the pension fund for the benefit of the retirees and the accrued savings of the taxpayers.”
But PSERS defended the investment fees it pays, and shot back at the “unfair” accusation, calling it “unsubstantiated and untrue.” It said that over the past 17 years, the fund had benefited from an additional $12.1 billion in incremental performance that would not have been possible without active management.
It also said that for every $1 spent on investment management fees during the past 17 years, active managers returned $3 in excess performance over their benchmarks.
These kinds of funds do need some active-ish management in terms of asset-liability risk matching, but I don’t really think that’s what’s going on here.
Note that the plans were (supposedly) fully-funded up to 2003, and have been eroding since then. We’ll see how much of that was an illusion born of actuarial asset smoothing in my next post. And how a big drop has been looming over the pensions since 2008… a drop that has yet to be fully incorporated into the actuarial valuation.
Related Posts
Mornings with Meep: I'm Happy I Didn't Wait
STUMP Classics: Public Pensions "Truths" and "Myths" -- Now Exposed
Calpers Governance Watch: Fallout from ex-CFO Meng Resignation
