Happy Pension News: Wisconsin State Pensions...a Beginning
by meep
Before we begin, I will admit: I do not understand the Wisconsin State Pensions.
Mainly because I haven’t dug into them much. But because they are supposedly 100% funded due to their design, I’m going to actually take the trouble to start digging through them to try to understand how it works.
This may ultimately not be a happy story by the time I get through with this, but it may actually be on the level. I’m just saying I’m skeptical, given how so many public pensions have been “fully funded”… and then we find out that is not the case.
So this is just a first shot at Wisconsin, with more to come later.
PROGRAMMING NOTE: STUMP POSTS MAY BE NON-FORTHCOMING FOR A BIT
Last night, it took me about four hours to get home. I may not have lost shiploads of men along the way, but I kind of understand how Odysseus felt. I circled around where I live, trying at least 4 different approaches until I found one not blocked by fallen trees/wires.
Today’s post comes courtesy of the fact I started it a week ago… but I don’t have others in the can after this.
Checking current outage info for my area, about 21 thousand homes/businesses out of 33 thousand in Westchester County are out of power, and my house is one of those 21 thousand. To be sure, we’ve got backups, but not enough for me to have enough internet power to write posts.
Driving from my house to Hartford this morning, I had to dodge around the tree that fell across lines [but not so bad we couldn’t get around it… just blocked one lane of the two-lane highway]…so I’m guessing it’s going to be a while before power comes back.
BLOOMBERG HOOK: ON WISCONSIN!
Wisconsin’s Pension System Works for Everyone
State employees and taxpayers share the risks of financing retirement. The result is a pension fund that underpromises and overdelivers.
…
Less attention is paid to the states that don’t have looming pension crises. Maybe that’s a mistake. Surely we could learn from, say, Wisconsin, the state with the best-funded retirement system. What does it do so differently?Wisconsin did not become the best-funded retirement system in the nation by asking a lot of state taxpayers. Only the District of Columbia, South Dakota and Wyoming spend less on pensions as a share of overall state and local government spending than Wisconsin does, according to the National Association of State Retirement Administrators.
Wisconsin also doesn’t exactly skimp on pension benefits. The average state and local pension benefit in Wisconsin in 2016 was $24,897, according to the Census Bureau, which ranked it 19th among the 50 states and District of Columbia. To see if differences in the cost of living might be skewing the ranking, I also divided the pension benefit by the state’s per capita income. Wisconsin came in 19th again.
Somebody must be paying for all this, and to some extent Wisconsin state and local workers are, with the employee share of pension contributions, 47.5 percent in 2016, higher than in all but two other states. 1 But the dollar contribution per plan participant in Wisconsin isn’t exorbitant, again ranking 19th among the states in 2016. Those state and local workers do not seem to be getting a bad deal, in other words.
…..
Credit for the innovation goes to a couple of state bureaucrats who were confronted with a difficult puzzle. The Wisconsin Legislature had decreed in 1975 that most state and local retirement systems be combined for efficiency’s sake into a single organization. These systems followed a number of different benefit formulas, with some closer to DC than DB, and the secretary and deputy secretary of the Wisconsin Department of Employee Trust Funds had to figure out how to make them all fit together.
…..
Their new idea was to offer participants a relatively modest pension with no cost-of-living adjustments 3 but supplement it with post-retirement “annuity adjustments” that are ratcheted up or down depending on investment performance, which is measured over rolling five-year periods to keep the adjustments from being too abrupt. Contributions to the plan are also adjusted based on investment returns and changes in life expectancy, with most employees and government agencies contributing 6.7 percent of pay each in 2018. And plan participants can choose to put half their contributions into a non-guaranteed plan that aims for even higher investment returns.
Footnote 3 on the benefit:
Currently calculated as years of service times 1.6 percent times the average of the highest three years of salary, with a reduction for early retirement. There’s an alternative formula that adds up the contributions you and your employer have made over the years and the return on that investment, and calculates a monthly benefit from that. Whichever is highest when you retire is the guaranteed benefit.
So let’s consider what most benefit formulas are:
- base benefit is some factor (usually 1% – 2%) of some average final salary
- some kind of cost-of-living adjustment, either set in stone (like so many Illinois 3% COLAs), supposedly as experience is good but in practice always granted, etc.
- if employees can make additional contributions, they often have some sort of guaranteed return (the most insane being the 8% guarantee from Dallas Police & Fire, but that benefit no longer exists)
VERY RARELY do you hear of benefits being adjusted downward.
And consider that contribution amount: employees pay about as much as do employers. That’s rather unusual, too.
PUBLIC PLANS DATABASE SNAPSHOTS
Again, this is just a first look.
The Public Plans Database page for this plan is here.
There are 615 thousand participants – this is one of the largest plans out there. If one checks recent history, here are the top ten largest plans.
- California PERF [Calpers] 1,859,554
- Texas Teachers 1,336,665
- Ohio PERS 1,067,155
- Florida RS 1,047,482
- NY State & Local ERS 950,429
- California Teachers 764, 746
- North Carolina Teachers and State Employees 672,514
- Wisconsin Retirement System 614,752
- Virginia Retirement System 567,872
- Arizona SRS 566,245
A very large and important pension plan.
While the employer contribution as percentage of payroll has been increasing, it’s fairly modest.
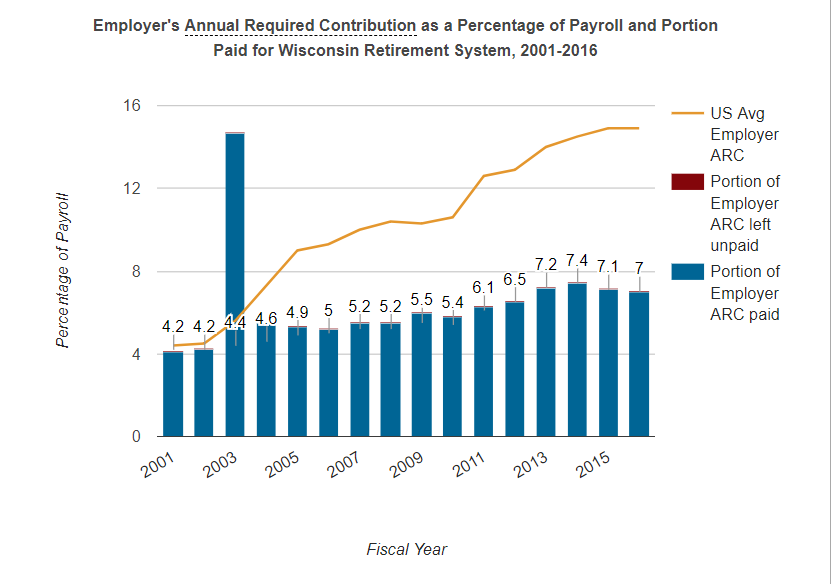
I don’t like the look of that spike — makes me think of pension obligation bonds, so I’ll need to look into that.
So over the next few weeks, I’m going to look at the benefit evolution, the asset performance, and other aspects of the Wisconsin pensions.
Is this too good to be true? Is this a good, sustainable way to design public pensions?
I don’t know the answer at this point – but maybe this really is a public pension success story.
We focus mostly on those in crisis, for obvious reasons. But for others not to end up in crisis, it helps to look at those that actually function really well.
But I remain skeptical — there have been other pensions that seemed to be doing well (like Detroit’s pensions), and it turned out there was all sorts of ugly stuff hidden inside, which came our during their bankruptcy.
On the surface, Wisconsin looks like it’s doing a good job, but I will try digging below that surface and see what I find. I’m really looking forward to this.
Related Posts
Which Public Pension Funds Have the Highest Holdings of Alternative Assets? 2021 Edition
Dallas Police and Fire Pensions: Pulling into the Abyss
Public Pension Watch: California and Illinois Executive Resignations, Spiking v. California Rule, and more!
