Memory Monday: Wildfires of 1918 with some Graphs on California Wildfires
by meep
Thanks to Jack Dean of Pension Tsunami for sending this.
With the death toll at 84 and counting, the Camp Fire in Butte County ranks as the deadliest wildfire anywhere in the United States in 100 years.
But the last time a wildfire killed this many people in America, many of the circumstances were eerily similar: Parched forests. Strong winds. Terrified townspeople killed while fleeing in their cars. Towns wiped off the map. A nation stunned.
It happened in 1918 in Northern Minnesota, near Duluth.
…..
On an unusually hot, sunny day on Oct. 12, [1918], and following a several years of drought, sparks from steam-powered locomotives ignited the vast pine forests of Northern Minnesota, about 100 miles north of Minneapolis.The monstrous blaze took people by surprise. Huge walls of flame, fed by piles of branches and bark left from logging operations, roared into towns like Cloquet and Moose Lake, wiping several off the map. The fire burned into the city of Duluth. Thousands of desperate people escaped on trains, or survived by diving into lakes and streams. The smoke plume was so big ships in the Atlantic Ocean reported it.
Scores were killed as they tried to flee in Model T cars, which crashed and burned along the rural roadways as flames overtook them. When it was over, more than 4,000 houses and 41 schools were destroyed, 249,000 acres blackened and 453 people were dead. Many bodies were never found. It was the worst disaster in the United States since the 1906 San Francisco earthquake.
…..
Families died while trying to take refuge in wells and root cellars. One family, the Soderbergs, lost 13 people, including nine children, when they hid in a root cellar and the fire consumed all the oxygen.A 27-foot-tall obelisk at Riverside Cemetery in Moose Lake marks the spot where 200 victims were buried in a mass grave.
The event remains the deadliest disaster in Minnesota history. After the fires, residents sued the railroad companies, but didn’t win repayment until 1935 after 17 years of court battles. In the weeks after, people flocked to the town to help it rebuild. As with other decimated towns, and likely with Paradise, some survivors moved on for good.
….
Wildfires that destroyed entire American towns were not uncommon in the late 1800s and very early 1900s.The 1871 Peshtigo Fire killed about 1,500 people in Wisconsin and Michigan, with so many fatalities that there weren’t enough survivors in some communities to identify the dead. The Great Fire of 1910 burned 3 million acres in Washington, Idaho and Montana, killing 86 and sending smoke plumes to New York. Afterward, the U.S. Forest Service set a policy of putting out fires by 10 a.m. the next morning, and radios, helicopters, planes and other equipment improved safety dramatically over the generations.
But now, with hotter, larger fires growing ever more intense in a warming world, creating “fire tornadoes” and walls of flame hundreds of feet tall, whole towns could again burn down, fire experts say.
“Fire scientists I’ve been talking to have been predicting this,” said Michael Kodas, author of Megafire: The Race to Extinguish a Deadly Epidemic of Flame. “We’re finally seeing it happen. It’s terribly sad. It’s probably going to happen again and happen more often.”
Fires destroyed whole neighborhoods in the San Diego suburbs in 2007. They burned into the city limits of Colorado Springs, the second largest city in Colorado, in 2012, destroying 346 homes. Last year, the Tubbs fire leveled 2,800 homes in Santa Rosa, killing 22 people.
Hmmm, well, let’s see about fires.
WILDFIRE DAMAGE STATS
The Insurance Information Insitute has the stats.
So yes, just eyeballing this, it does look like more acres are burned… but it may be due to higher temps… and it may be due to reduced forest management.
That’s in terms of acres, not dollars of damage, and that’s a different issue as well.
But let’s just focus on California to begin with.
VISUALIZING CALIFORNIA FIRES
Via this December 2017 Axios post, I found this page of California fire stats. More data are here.
The Axios folks were kind enough to share their github, and the data really should be updated to this year (and I don’t have time to do it.) Maybe somebody else?
This is the image they have:

That is difficult to look at — the height of the curve is number of acres burned, and the color is duration…that’s really not intuitive. Also, it looks like 2007 and 2008 were really bad…. how is that saying anything about more recent trends? When somebody uses a very hard-to-read graph like that… I get suspicious.
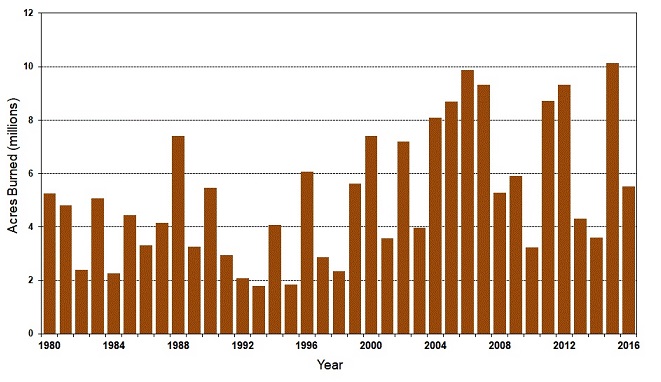
First, let’s start with something simple — like the first bar graph, let’s do total number of acres burned per year:

So, 2007 and 2008 were pretty bad years. 2008 had more acres burned than 2017. Of course, once all the 2018 data come in, I wouldn’t be surprised if the numbers are worse… but perhaps this shows a cyclical pattern (related to El Nino/La Nina? I don’t know.)
Okay, maybe there were more frequent fires:

Nope. Okay, maybe we need to look at some rates: Number of acres per fire, Number of acres per day, Number of days per fire:

Hmmm, looks like the fires individually burn more acres per fire, and run for more days — these two items are linked, obviously. The longer a fire burns, the more acres burned. This could be due to poor fire response, poor landscape management, and more. But if one wants to look at this 17-year trend and shout CLIMATE CHANGE! … you need something a bit more definitive.
FWIW, I don’t think the graph-maker for the first complicated graph was necessarily intending to be misleading. I think they just wanted to use their cool graphing code, without thought of how easy it was to interpret… and they just ignored 2007/2008 in eyeballing the trend.
My line and column charts are very simple (indeed, I should have split that last one into three graphs, but I don’t feel like copying three separate images at this point… I think you can see the trend… or lack thereof.) If you want to get at truth, a bunch of simple graphs is easier to interpret, and better to use, than whatever fancy dataviz examples you’ve looked at.
By the way, I have a webcast on data visualization techniques with Excel coming up — check it out! It’s on December 11, and while I will be using actuarial-related examples, one need not be an actuary to understand.
Spreadsheet with the data and graphs.
FOREST MANAGEMENT
I can’t remember if I’ve ever mentioned: my granddaddy Campbell was a forester for Georgia Pacific. I don’t think he had to worry about wildfires, though… he was a forester in the area of South Carolina where Francis Marion got his nickname of The Swamp Fox. My granddaddy’s toenails were sedimentary rock, built up from all the minerals in the swamp water he used to work in. To be sure, droughts could occur, but in general, that area is pretty damp.
But even so, there was a schedule for culling the pineries and manage the forest… after all, Georgia Pacific had paper to make. Earlier generations of paper mills had denuded entire areas of the Southeast, which were built back up with the CCC during the Great Depression (granddaddy was a part of that as a teen, iirc). There is a problem when too many trees are cut away… and there’s huge problems when underbrush is not cleared up. For pine forests, and some other conifers, they need burning every so often so that the cones release the seeds.
It’s called fire-mediated serotiny, but it looks like the issue may be more seeds actually making it into the soil than the need for fire to release seeds … at least in North America: (that is, the fire is needed to clear leaf litter, etc, preventing the seeds from taking root in soil)
The relative importance of serotiny can vary among populations of the same plant species. For example, North American populations of lodgepole pine (Pinus contorta) can vary from being highly serotinous to having no serotiny at all, opening annually to release seed.11 Different levels of cone serotiny have been linked to variations in the local fire regime: areas that experience more frequent crown-fire tend to have high rates of serotiny, while areas with infrequent crown-fire have low levels of serotiny.212
…..
Similar pressures apply in Northern Hemisphere conifer forests, but in this case there is the further issue of allelopathic leaf litter, which suppresses seed germination. Fire clears out this litter, eliminating this obstacle to germination.
Interesting.
Lack of forest management was one issue here, but there were also others, which we will see below.
PREVENTING FIRES
California Wildfires: What Will It Take to Prevent the Next Disaster?
The spread and intensity of the wildfires raging in California call for a far higher level of fire prevention, containment and disaster management than the state has had previously. Property owners and developers, fire departments, utilities and other entities need to strengthen collaboration, and revisit building codes and insurance industry practices, according to experts at Wharton and the University of California, Berkeley.
At last count, three major fires are still active in the state, claiming 44 lives and destroying more than 7,000 properties as they burned through more than 220,000 acres. The state has “Red Flag” warnings in place, which means conditions are ripe for further fires. President Trump issued a “Major Disaster Declaration” for California, responding to a request from Gov. Jerry Brown over the weekend. Such a declaration enables the Federal Emergency Management Agency (FEMA) to provide a range of federal assistance programs.
…
Also underway are a quarter of a million inspections that focus on the responsibilities of the state and homeowners on multiple fronts, such as the need to properly maintain vegetation around houses in order to increase fire resilience. The state has the personnel and the funding to track fire-prone homes in the affected areas in a three- to five-year cycle, Gilless said.Gilless noted that experiments are also taking place with innovative bond offerings to finance projects to help prevent wildfires. One is a $4 million “forest-resilience bond” created by the nonprofit World Resources Institute and start-up Blue Forest Conservation, according to a Los Angeles Times report. The bonds aim to find “profit-seeking investors” willing to invest in projects that reduce the risk of costly wildfires and potentially ease the risk of drought.
Other state programs focus on vegetation management and studying tree coverage to ensure that there is sufficient separation between the canopies. Wooden roofs obviously pose risks, and there are also efforts find fireproof alternatives. “That is important with these wind-driven fires of 50 to 60 miles an hour, because they’re throwing embers which can ignite a roof a half a mile or a mile in advance of the flaming front of the fire,” Gilless said.
….
Getting Homeowners to ActClearly, there is recognition that homes have to be better designed and fireproofed, said Kunreuther. “But the challenge is, how do you get homeowners to do this? A homeowner could say, ‘I may do all of these things, but then there’s going to be a fire from my neighbor that is going to spread to my house and I’m still going to be in trouble afterwards.’ The interdependency and interconnectedness of wildfires makes it really hard [to implement those measures].”
…..
Insurers vs. UtilitiesKunreuther noted that home insurance policies typically cover fire from any source, including wildfires. However, here again, he sensed a challenge for both insurers and the utilities. Insurers could ask the utilities to pay the claims if they feel the latter was the cause of the fire, he said. “Electric utilities may also cause wildfires when high winds bring down power lines or conductors or when animals, trees, or other vegetation make contact with power lines,” noted a recent paper published by the Risk Management and Decision Processes Center.
Insurers could pursue utilities for claims using a so-called “subrogation” clause where they have the right to pursue a third party for a loss, Kunreuther said. Insurers could use a legal provision for what is called “inverse condemnation,” if they could establish that a utility caused a fire. (Public utilities are granted the power of condemnation, or eminent domain, to take over private properties in the course of discharging their regulated activities, but the reverse, or “inverse condemnation,” occurs when the affected private party brings a claim.) “The utilities may have to pay even if they follow all the regulations and standards,” he said. “If a tree is blown down and destroys a power line that has been meeting all these standards, the utilities may still be responsible in California because of this law.”
It seems to me that insurers may be the most effective way to get homeowners to clear all the brush and crap that fuels fires around their own homes, as well as put in fire suppressing landscaping…states should be concentrating on large forests, power lines, etc. It doesn’t need to all come from one entity to reduce the effects.
Let’s look at damages by number of deaths, and by likelihood of fires.
DEADLIEST FIRES BY BODY COUNT
Deadliest U.S. wildfires
1,200+ deaths, 1871 (Peshtigo Fire, Wisconsin)
453+ deaths, 1918 (Cloquet Fire, Minnesota)
418+ deaths, 1894 (Hinkley Fire, Minnesota)
282 deaths, 1882 (Thumb Fire, Michigan)
87 deaths, 1910 (Great Fire of 1910, Idaho and Montana)
84 deaths, 2018 (Camp Fire, Paradise, California) [obviously, this could go higher]
65 deaths, 1902 (Yacolt Burn, Oregon and Washington)
29 deaths, 1933 (Griffith Park Fire, Los Angeles, California)
25 deaths, 1991 (Tunnel Fire, Oakland Hills, California)
22 deaths, 2017 (Tubbs Fire, California)
19 deaths, 2013 (Yarnell Fire, Arizona)
16 deaths, 1947 (The Great Fires of 1947, Maine)
15 deaths, 2003 (Cedar Fire, San Diego County, California)
15 deaths, 1953 (Rattlesnake Fire, California)
15 deaths, 1937 (Blackwater Creek Fire, Wyoming)
14 deaths, 2017 (Gatlinburg, Tennessee)
13 deaths, 1994 (South Canyon Fire, Colorado)
Again, these are wildfire deaths.
How about industrial fires?
The most famous such fire was the Triangle Shirtwaist Factory, which was near where NYU is now. I remember the various unions coming on the anniversary of that fire – March 25 – to do some pro-union rallies. About 150 workers died in that fire. Some other ones can be seen here.
In all these situations, there are methods of preventing the fires from spreading, making it easier for people to escape, etc. Wildfires can be far more destructive compared to industrial fires because many industrial fires are in urban areas with deliberate fire prevention for industrial sites in particular, and again, because industries know they’re in danger (and insurers won’t necessarily cover if negligent) they invest a lot in fire prevention, suppression, etc.
Cities have always had fire danger – think of the Great Chicago fire and the Great Fire of London. Note that (thank goodness) we generally don’t have such awful city fires anymore… but people forget it takes a lot of work and planning to prevent this. Also, asbestos did really help a lot.
FIRE RISK: LIVING IN DANGEROUS AREAS
Verisk did a 2017 estimate of fire risk by state.. let’s look at the ranking.

Note how pretty much all the top states are on the West Coast or in the Southwest. I wonder how much this is related to percentage of the land (especially forest land) are owned by the federal government. Of course, it can be due to those states being more arid than East Coast/Midwest states.
RELATED STORIES
- Wildfire losses should have been priced in, says Fitch
- California wildfires to cost over $10 billion “if not much more” – Aon
- Wildfires could cost insurers $5bn to $10bn: Credit Suisse analysts
- Was Global Warming A Significant Factor in California’s Camp Fire? The Answer is Clearly No.
- Chuck DeVore: California’s Deadliest Fires Could Have Been Mitigated By Prevention
- Betsy McCaughey: Actually, even California says Trump is right about the wildfires
And let’s end with something stupidly amusing: BuzzFeed Has Apparently Never Heard of Smokey the Bear
To be fair, it’s more like one person never heard of Smokey Bear, and there’s no editorial process that I can tell at BuzzFeed. Also, I can understand why Smokey Bear sounds like a joke to a 20-year-old who didn’t grow up on the PSAs in their particular area.
And some people do not necessarily know the distinction between foresters/rangers supervising controlled fires in forests versus telling people not to leave their campfires smoldering (soak it with water!), not to throw their cigarette butts on the ground, and just frickin don’t play with matches, kids. Some people should just not be allowed near open flame.
Related Posts
Geeking Out: Best Way to Graph Stock Market Indices
Geeking Out: How Dependable are Lottery Revenues? And Government Data Sources?
What's the Income Percentile for the Obamas? Number-Checking
