Public Pension Choices: Visualizing the Sources of Bad Experience
by meep
There are a lot of choices involved in public pensions.
For example, there is the choice of how to invest public pension funds:
State and local pension plans invest roughly twice as much in risky assets as would a prudent individual saving for retirement. Indeed, the Society of Actuaries, which represents the actuarial profession, recently pointed to public-pension investment practices “that go against basic risk management principles.” With $3.7 trillion on the line, risk-addicted pensions need an intervention. The question is who can do it.
Many individuals follow a rough “100 minus your age” rule to determine how much risk to take with their retirement savings. A 25-year-old might put 75% of his savings in stocks or other risky assets, the remaining 25% in bonds and other safer investments. A 45-year-old would hold 55% in stocks, and a 65-year-old 35%. Individuals take this risk knowing that the end balance of their IRA or 401(k) account will vary with market returns.
Now consider the California Public Employees’ Retirement System (Calpers), the largest U.S. public plan and a trendsetter for others. The typical participant is around age 62, so a “100 minus age” rule would recommend that Calpers hold about 38% risky assets. In reality, Calpers holds about 75% of its portfolio in stocks and other risky assets, such as real estate, private equity and, until recently, hedge funds, despite offering benefits that, unlike IRAs or 401(k)s, it guarantees against market risk. Most other states are little different: Illinois holds 75% in risky assets; the Texas teachers’ plan holds 81%; the New York state and local plan 72%; Pennsylvania 82%; New Mexico 85%.
….
Yet public-plan managers may see little option other than to double down on risk. In 2013 nearly half of state and local plan sponsors failed to make their full pension contribution. Moving from the 7.5% return currently assumed by Calpers to the roughly 5% yield on a 38%-62% stock-bond portfolio would increase annual contributions by around 50%—an additional $4 billion—making funding even more challenging.
But the fundamental misunderstanding afflicting practically the entire public-pension community is that taking more investment risk does not make a plan less expensive. It merely makes it less expensive today, by reducing contributions on the assumption that high investment returns will make up the difference. Risky investments shift the costs onto future generations who must make up for shortfalls if investments don’t pay off as assumed.
Oh, I wouldn’t count on that “must”. That’s another choice.
The choice of investment approach is tied to the discount rate assumption (and I think it shouldn’t be, but that’s not an argument for right now). There has been a lot of jawboning about historical rates of return — usually predicated on time-weighted, not cash-weighted returns. That’s another technical discussion I do not want to dig into right now.
There are a lot of choices surrounding public pensions: discount rate, investment allocation, benefit design, actuarial assumptions (other than discount rate), actual contributions made. The problem is that they interact a great deal, and the effect of each individual choice may be small in any given year, but over several years they begin to add up.
This is where my idea proposed to the Actuarial Standards Board came from: I knew that there was a year-by-year analysis of why the unfunded pension liability changed, by cause, done as part of the actuarial analysis of a plan. But to really understand how things have come to where they are, one really needs to look over a long time period.
Here is the first plan I have developed this historical analysis for: the Texas Teachers Retirement System.
There’s nothing particularly special about this plan other than they made it really easy for me to get two decades’ worth of development of the unfunded liability:
You saw previous versions of this graphic in my teaser post at Thanksgiving, and I’ve labeled it and switched the vertical axis to make it more clear what’s going on.
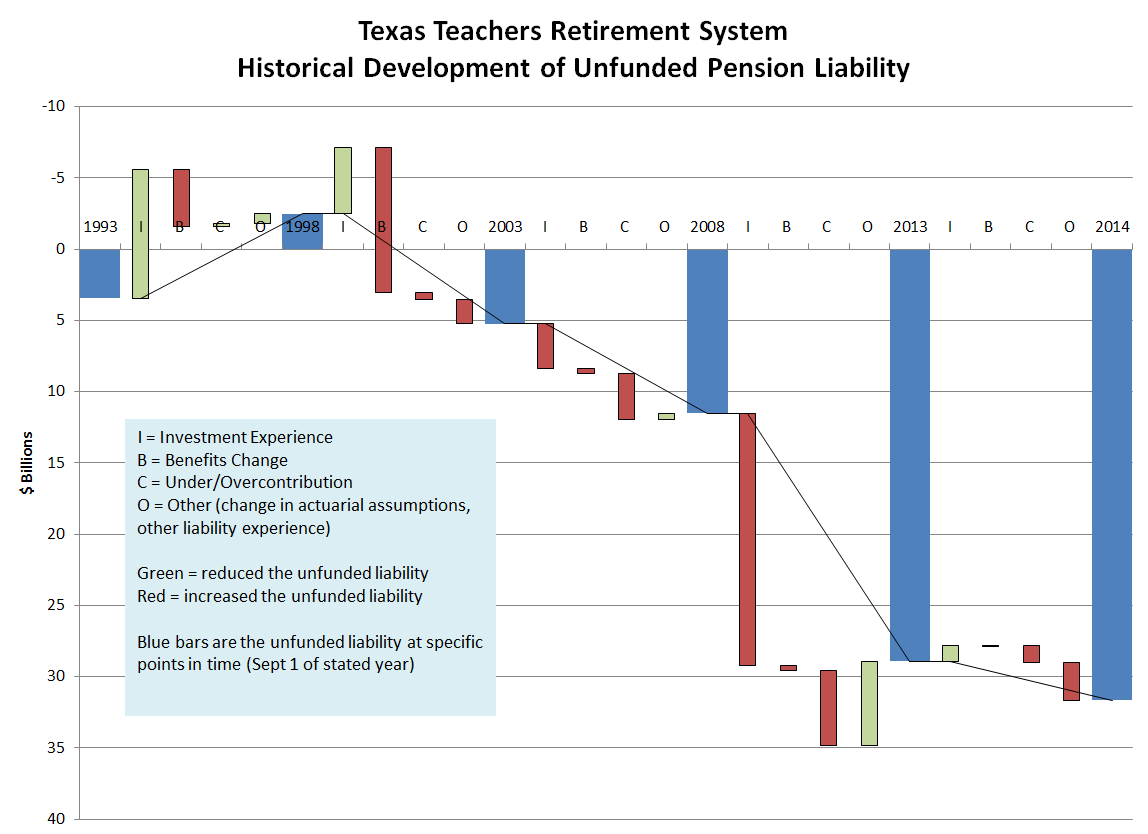
The blue bars are the unfunded pension liability for Texas TRS at different points of time – starting at Sept 1, 1993 and ending at Sept 1, 2014. That final bar, sitting at almost $32 billion, is the size of the unfunded pension liability as of Sept 1, 2014. It started at $3.4 billion in 1993. What happened?
That’s what the green and red bars in between represent. This is a waterfall graph, showing the changes in the unfunded liability by cause in between. If the bar is green, it reduced the unfunded liability. If the bar is red, it increased the liability.
There sure is a lot of red in that graph.
I aggregated the causes into a few item: I = investment experience, B = benefit changes, C = under/overcontribution, O = everything else. The everything else bit tends to be small, but you’ll note that there is one place where it is substantial. I’ll explain in a bit.
So let’s walk through history.
We start in 1993, before the market really starts to take off. From 1993 to 1998, stock returns are awesome! So much so that the pension becomes “overfunded” by 1998. But not as overfunded as it could have been, because the Texas legislature boosted pension benefits in that period. Effects of overcontributions and other items were negligible.
(Note: Democrat Ann Richards was governor of Texas from January 1991 to January 1995. George W. Bush was governor from 1995 to 2000. If you dig into the legislative makeup, you’ll find the Democrats controlled the Texas legislative houses in the 1993 – 1995 period.)
Now it starts to come apart from 1998 to 2003. This spans the height of the market, and its fall in the early 2000s.
Even with investments going south by the end of the period, the overall investment experience of 1998 – 2003 is such that it would have continued the Texas TRS pension in positive range.
But look what obliterated that surplus: benefit increases.
Again, this is not unique to Texas. This is just the first plan I’ve been able to fully develop this analysis for, but I see similar behavior in other pension plans in other states around the same time period. California did this, notoriously. Illinois did it. Pretty much everybody did it — there was a pension surplus, and rather than say “Woo, we’ve got a cushion against the inevitable stock market crash!” they said “Oooh, let’s buy more votes!” and boosted the pension benefits right before the market went down.
Ooops.
The benefit boost between 1998 and 2003 was such that not only did it wipe out the surplus, it pushed the pension into negative territory, with the unfunded liability rising to $5 billion.
Eh, $5 billion is manageable, right? Well, that was 11 years ago. What has happened since then?
Nothing but bad, bad news.
Investments are the worst piece of this news: the market downturn in the early 2000s was nothing like the bottom falling out in 2008. That was really bad. Thing is, that was using assets being smoothed on a 5-year basis (not an unusual technique, and when looked at over the long haul, especially with regarding to planning funding, this is not a bad technique, either.) Taking these chunks in 5-year intervals reduces the impact of the smoothing, but keep in mind that there is bleedover in experience from one period to the next. At least with regards to asset experience.
Anyway, that green bar for Other causes between 2008 and 2013 — that’s mainly due to liability experience being different from the actuarial assumptions in a positive way. Maybe people were dying earlier (eh, I doubt it) or the benefits were less than expected (that seems more likely — if people’s hours were getting cut, or raises were being kept down, or staffing was reduced… I can imagine that all sorts of things ate into the benefits actually being paid out.) There were actuarial assumption changes over that period, but they were minor.
Note that the undercontribution to the plan over that period (pretty standard in a case of recession — states don’t have the money of when the taxpayers don’t) matches the liability experience boost almost exactly. Hmmm.
By the way, the actuarial assumptions have changed recently: in a way to increase the unfunded liability. I haven’t looked into this deeply, but it could be from a reduction in discount rate or increased longevity assumption.
The last interval is from Sept 1, 2013 to Sept 1, 2014. This is mainly an artifact of the time period I had covered — 21 years, not a nice, even 20. But having that last year split out shows you what one year’s worth of experience generally looks like: the changes are relatively modest. You really need the long view to see that there are two big causes to the unfunded liability growing so large:
1. Risky investments and
2. Wiping out all the upside of those risky investments by boosting benefits
To quantify — over the period from 1993 to 2014, 22% of the unfunded liability change was due to the investment experience. A whopping 53% was due to benefit increases (mostly spurred by investment gains in the 90s). Undercontributions made for 35% of the change. If you add these up, you’ll see they add to 110% — that’s because actual liability experience reduced the unfunded liability. It was -10% of the change.
Anyway, I will be doing this analysis for a variety of plans. I will probably not be able to get 20+ years of data for each plan I look at — I’ve got something for Illinois TRS that I will do next, but I’ve not been able to push it back as far as the plan above.
Anybody who does have a plan in specific you’d like me to look at, let me know!
Email me at marypat.campbell@gmail.com.
Additional:
This is the year-by-year development of the above graph (instead of in 5-year chunks)

Related Posts
Around the Pension-o-Sphere: Actuaries Testifying, New Standards, Actuary Bloggers, Pew Report, and Connecticut
Public Pensions Watch: Sometimes Politicians Do the Right Thing
How to Lose Money Quickly: Trading in a Volatile Market
