Preliminary look at 2022 U.S. Total Mortality - Continuing Excess Mortality
by meep
Rather than continue to wait for the CDC to get the finalized database for 2021 up in CDC WONDER, I’m moving on with 2022 U.S. mortality, because I am starting to see the “post-COVID” pattern, and I am not liking it.
I am just looking at patterns in this post, not causes, and not digging into fine detail. This is just setting out the lay of the land.
If you are new to STUMP (I’m meep, the MP portion of STUMP), this is a “Mortality with Meep” piece. I write about things other than mortality, but you can just go to that section if that’s what you want to focus on. On my substack posts, I generally share my spreadsheets with the original data draws, all my graphs, and everybody is free to download and do whatever you want with this stuff. I keep my posts free (I just charge for people to post comments. Heh.)
Details on methodology are at the end of the post.
Top-level: excess mortality is still here
If we look at the full pandemic period of what we have so far:

A note on the data. There was an update to the provisional CDC WONDER database on January 4, 2023, with death data reported through December 17, 2022.
Obviously, the December 2022 data were incomplete, so I stopped my graphs at November 2022. However, as you will see, November 2022 reported deaths are probably still a bit too low as well — there are reporting lags, after all, and it will probably take another month before that number is close enough for good comparisons.
But let us look at the pattern – we see the multiple COVID waves easily – the initial spike in April 2020, the smaller one in summer 2020 but then the very large winter 2020-2021 wave… and then the Delta/Omicron wave of winter 2021-2022 with its double-hump structure.
But 2022 is a bit odder.
Let’s just zoom in on 2022.

So here is the thing: after the winter death wave was over by April, more or less, there was persistent excess mortality in the rest of 2022.
Digging into age grouping mortality
To get at the dynamics of that extra mortality, I decided to look at age-related breakouts. The reason I did this is two-fold:
1. We generally don’t call age a co-morbidity, but it is the biggest driver of mortality rates for pretty much everything. So this is an obvious dimension to investigate.
Are all age groups getting equally hammered on excess mortality, or are some being more affected than others, on a relative basis?
COVID itself has a much high effect on older adults than other groups (duh), but other causes of death have a disproportionate effect on other groups (such as drug overdoses or suicide). So looking at age patterns can give us a clue.
2. The nature of the data is such that we can get good-quality info about ages and sex before pretty much anything else.
Cause of death attributions generally takes the longest to get good data on. Yes, that’s what I want, but as you can see, I’m sitting here waiting for finalized 2021 data so I can get a more stable analysis… and it’s 2023. I will talk more about the cause of death problem later in the post.
For the rest of the post, I’m going to look at the monthly change in mortality by comparing each month’s daily rate (adjusted for population – see methodology at the end of the post) against the same month for the 2018/2019 average. This is going to give us a metric in excess mortality.
Seniors mortality
Let’s start with my oldest age groups:

These groupings are pretty in sync with each other for all of the COVID waves, and they seem to differ the most between these waves.
2022 only:

We really see this separation in 2022.
This is kind of a weird pattern (I will note I’m excluding age 85+, because there are some difficulties in making population size estimates, but I may do that in a separate post in the future.)
It looks like the excess mortality goes away for the age 70-74 years group. But that we get the highest for age 75-79, with age 80-84 close by.
It may be, at the level of “error bars” (due to my estimates), that these senior groupings of age 75-84 are at the same level of excess mortality, essentially.
For the younger seniors, age 60-69, they are somewhere in between.
We are about to see that the senior group really doesn’t have much in the way of relative excess mortality compared to the younger adults — and this may be because that COVID has been the largest driver for excess mortality for these groups, and this has been receding.
Middle-aged mortality
Get ready for the ugliness.

The main thing I want to point out is the vertical scale for this graph. It goes to 100%. That is, the top group almost doubles their daily death rate — in September 2021, the age 40-44 group had an 88% increase compared to their 2018-2019 average rate.
Age 40-44 had the worst relative experience, by the way, throughout the pandemic.
2022 only:

Contrast this graph to the seniors and you’ll see that after the omicron wave of COVID subsides, unlike with seniors where the excess mortality in April 2022 goes down very low, excess mortality is very elevated for this group.
Keep in mind that for ages 40-44 the “base mortality” rate generally is very low, so a 88% increase, for example, is not necessarily a large number of deaths over the entire country. Indeed, in September 2021, the total number of deaths recorded for ages 40-44 was only 7, 229 — that’s the total, not the increase. Contrast that to 35,862 deaths in that month for the age group of 75-79 years for September 2021, which was a 35% increase in the rate for that group at the time.
Still, when we want to think about the acuteness of impact, it really is the percentage increase of the expected amount you want to use as the metric, and not the absolute difference.
To be blunt, we expect old people to die at higher rates.
That’s why I’m looking at percentage increases here, and not merely the number of deaths per day.
Young adult mortality
And now for our last adult group:

This one is a bit messier, and less driven by the COVID pattern. You can see the Delta spike, but other than that, you’re seeing elevated mortality… and not much in the way of COVID waves.
Again, some of this is due to the very low death numbers.
2022 only:

This is showing a similar pattern as the middle-aged, but it’s really the older groups (age 30-39) that are displaying the higher relative mortality increases and the younger groups have much lower levels of elevated mortality.
Where from here?
Note that I didn’t do anything with children (or babies) – their pattern is very erratic, and in the case of actual children (as opposed to “children” of 19 years old… but let me drop that for now), mortality is very low compared to all adult groups. It is very difficult to do appropriate statistical analysis because of the low numbers you see there.
And I’ve been staying away from infant mortality analysis because that one gets very complicated, as it’s entwined with birth rates as well.
The point of the above exercise, though, is to get a baseline to start from — we do see that we look to be emerging from the COVID “death waves”, but we have substantial continuing excess mortality.
That’s the main takeaway.
Digging into cause of death data takes longer
Once we start from there, we can start digging into causes. That does take longer, and this is not unique to the pandemic era. I stick to “underlying cause of death” (for which there is one and only one for each death certificate) in my analyses here.
You can look into the posts I link below for analyses I did for 2020-2021, and you will see that I’m anticipating for younger adults that drug overdoses and other “external causes” will be big drivers for their 2022 excess mortality. The problem with that is that those causes take longer to report on, so I have to wait at least 6 months before those resolve in the system. There are also other details that need to get firmed up to do proper analysis on.
This is why, in 2023, I’m still waiting for 2021 death data to get finalized. This has been pretty standard – for example, this 2017 blog post on suicide rates has data going up to 2014, as it was the most recent finalized data available at the time. That gives you an idea of how long the lag used to be — it’s actually gotten somewhat better.
If you’re on the substack post, you can go to the bottom and download the spreadsheet that has all these graphs, the original data, and the analysis that went into the graphs. And you can jump off from there and do your own calculations if you wish.
I will be doing further investigations to the extent I can with provisional data, and likely doing some podcasts and videos to further explain what you see here, as well as doing some geographic and further demographic splits to see if we can determine what may be driving the trends.
My main caution is to keep an open mind — I was flabbergasted back in 2020 when I started looking at some of the non-COVID increases, and determining what those were. It can differ a lot by age group, and I’m not assuming that the drivers in 2022 (and now in 2023) are the same as they were in 2021 and 2020.
That said, I have a feeling as to order of magnitude of what’s there, and I don’t feel good about it.
This may give a clue from my Movember 2022 post on men and drug overdoses:
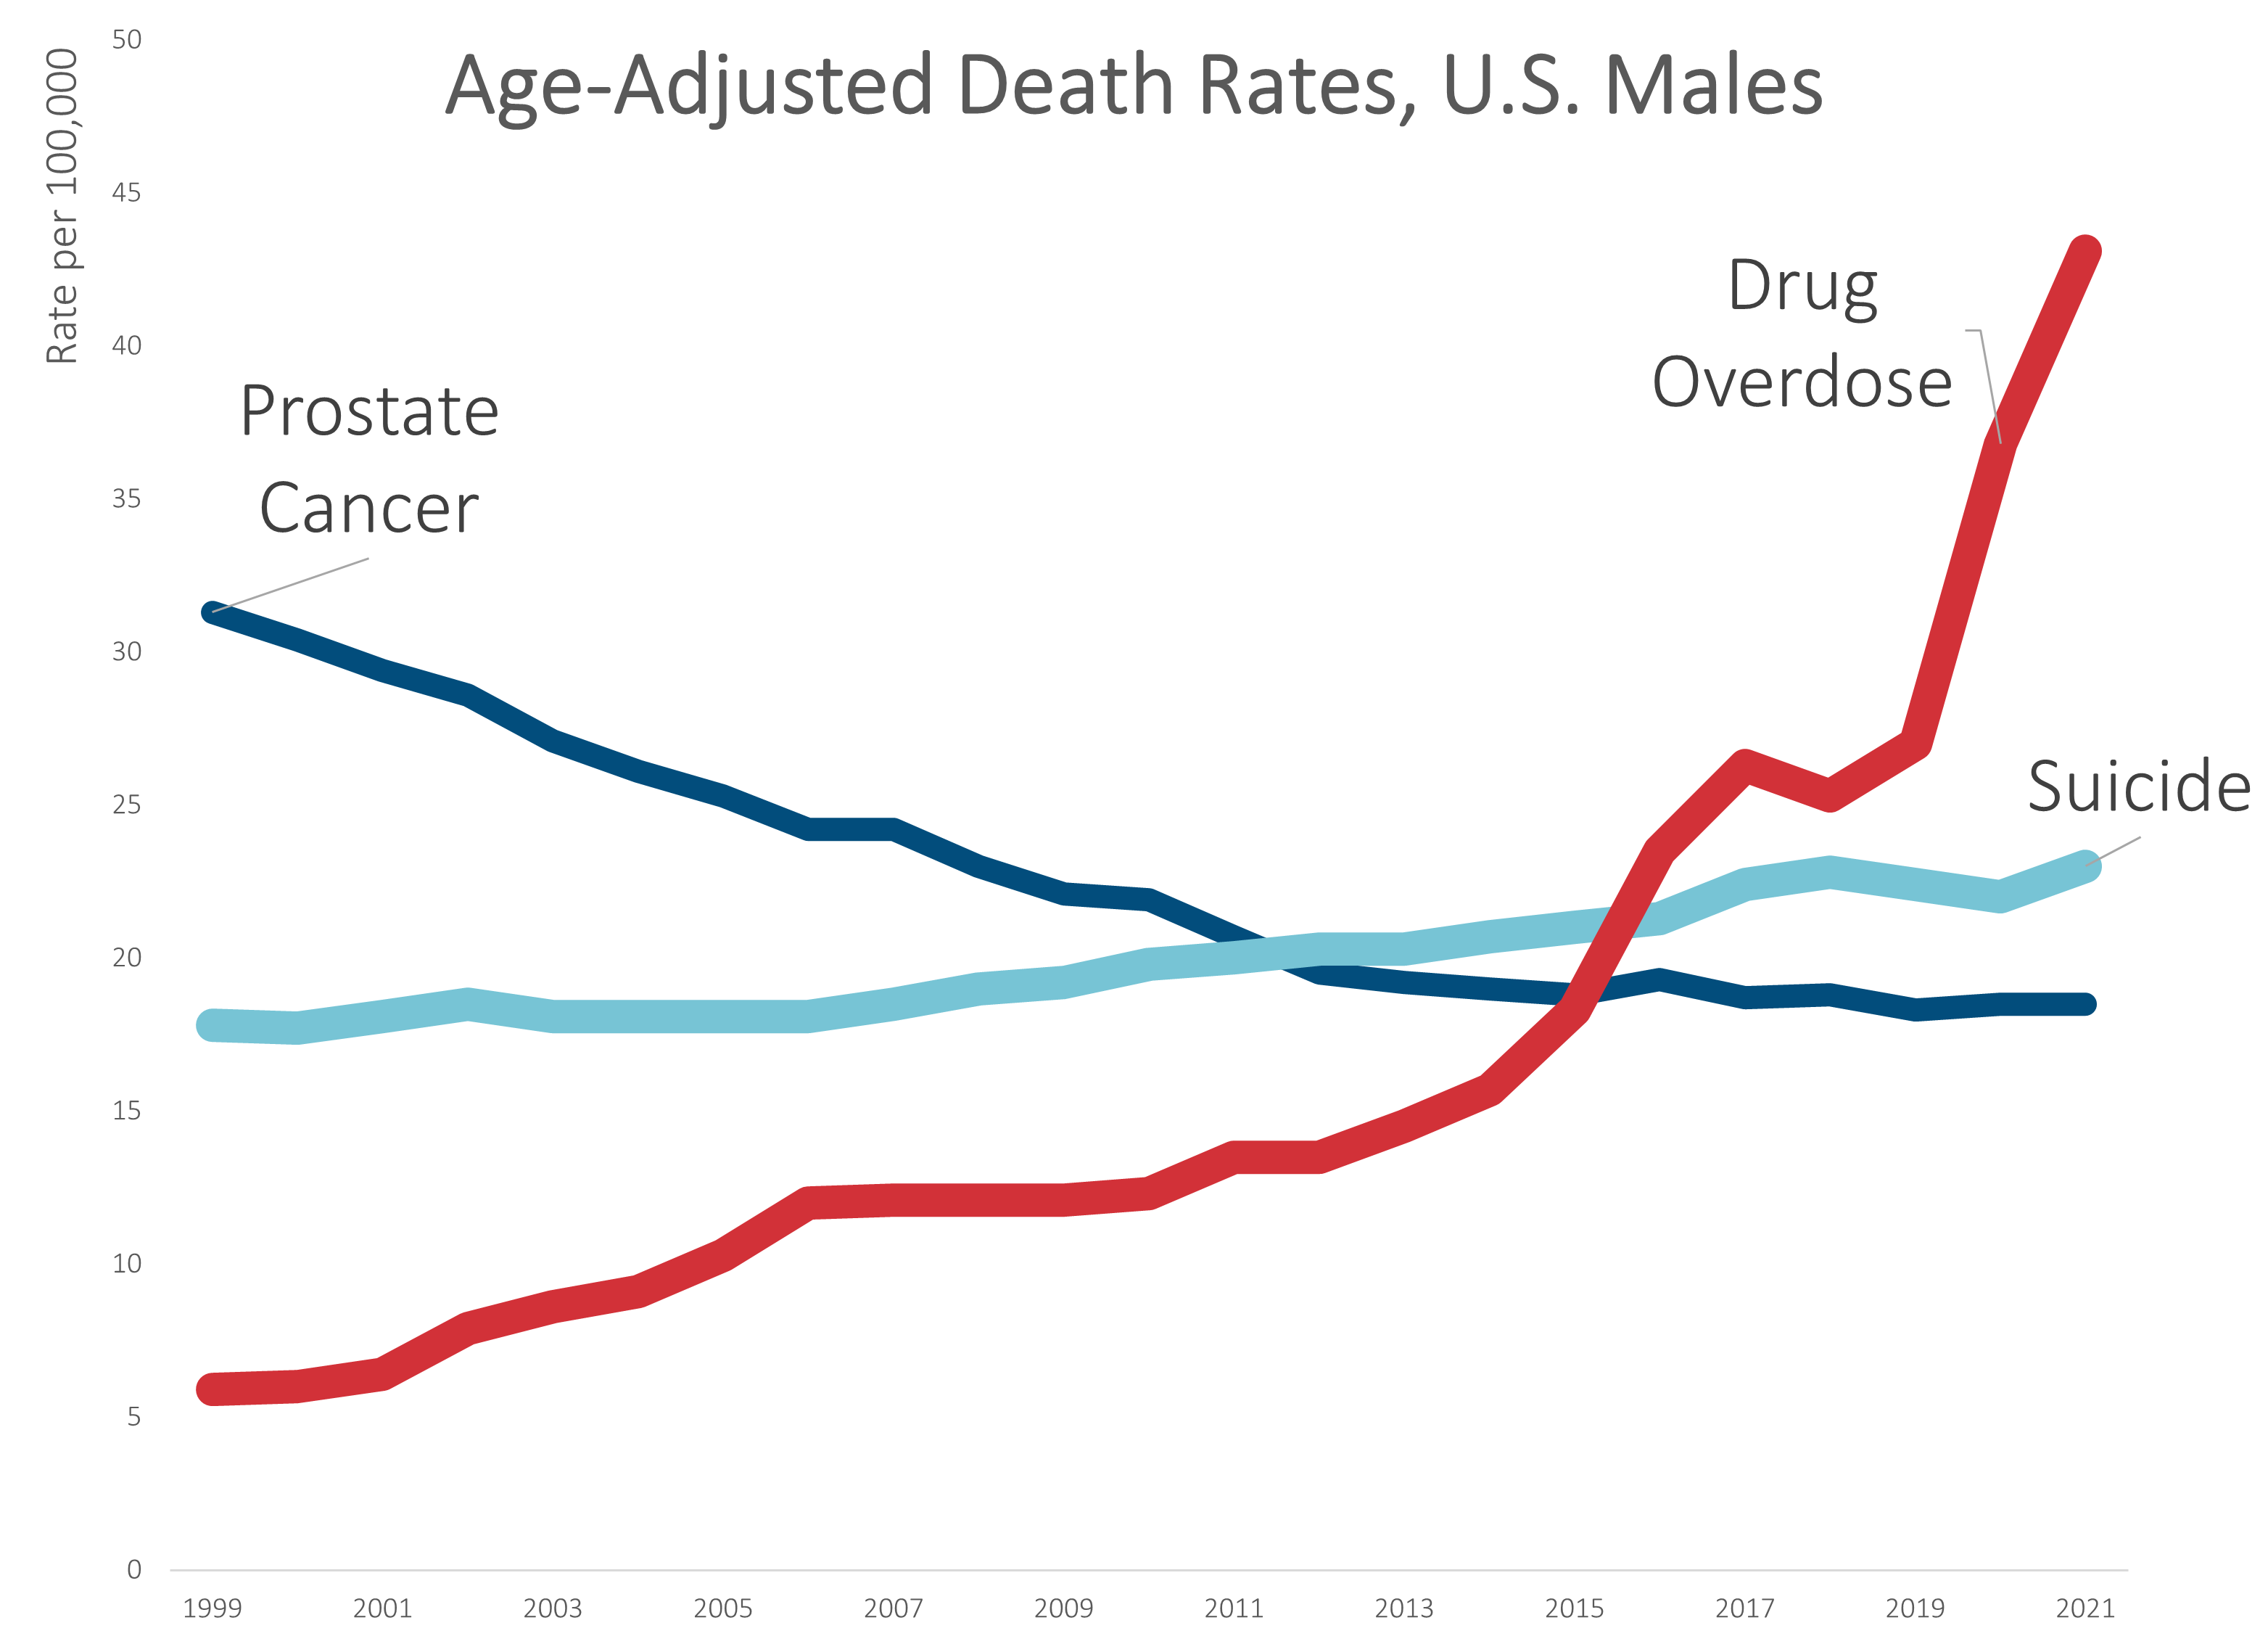
Yeah, more on that another time.
Prior posts on 2020-2021 excess mortality by age groups
Children — Age 1-17: Childhood Mortality Trends, 1999-2021 (provisional), Ages 1-17 Revisited: Teen Mortality Increased 30% 2019 to 2021
Young Adults — Age 18-39: approximately the Millennials in 2020-2021 Part 1 and Part 2, plus the podcast
Middle Agers — Age 40-59: approximately Gen X – Middle-aged Massacre (too!): Increase in Mortality for Ages 40-59 in the U.S. for 2020-2021 Mainly Driven By COVID
Young Seniors — Age 60-79: approximately Boomers – Baby Boomer Mortality Experience: Welcome to Old Age! 2020-2021 U.S. Mortality Increase for Ages 60-79 was Mostly COVID
Old Seniors — Age 80+: mainly Silent Generation (as older generations are mostly dead at this point) – Silent Generation Has Odd 2021: COVID Over 100% of 2021 Mortality Increase Compared to 2019 in the U.S. for those over age 85
Earlier overview of 2020-2021 mortality in video — May 2022: U.S. Mortality Trends Through the Pandemic
That one comes with a video:
Methodology
Monthly deaths in total for the U.S. and by five-year age groups were extracted from CDC WONDER as of 6 January 2023 from the provisional death statistics database.
Suggested Citation: Centers for Disease Control and Prevention, National Center for Health Statistics. National Vital Statistics System, Provisional Mortality on CDC WONDER Online Database. Data are from the final Multiple Cause of Death Files, 2018-2020, and from provisional data for years 2021-2022, as compiled from data provided by the 57 vital statistics jurisdictions through the Vital Statistics Cooperative Program. Accessed at http://wonder.cdc.gov/mcd-icd10-provisional.html on Jan 6, 2023 5:44:30 AM
For population estimates, for 2018 and 2019, the population estimates for the 10-year age groups from CDC WONDER (which ultimately came from the Census Bureau) were used. For 2020-2021, estimates from the U.S. Census Bureau for 1-year age bands on July 1 of each year were used.
For 2022, the whole country estimate for the full population, plus a trending of population proportions were used. Data source: National Population by Characteristics: 2020-2022, extracted 6 Jan 2023. That page was last updated 5 Jan 2023.
To compare increased mortality, the average for the same month in 2018 & 2019 were compared against that month 2020-2022. For each month, the average number of deaths per day was calculated (so that we wouldn’t have to get persnickety about February being shorter than the others, and sometimes having 29 days, yadda yadda). For the age groups, a death rate was regularized using the population estimates as described above.
If this is the substack post, the spreadsheet with the original raw data draws from CDC WONDER as well as the Census data used will be downloadable below.
Related Posts
Mortality with Meep: How to Get Lots of Supercentenarians? Pension fraud!
Supreme Court Mortality Projection Update!
CORRECTION: The French ARE actually long-lived
