2022 Top Causes of Death in the U.S. by Age Group
by meep
As I noticed CDC WONDER was updated, it’s time to update ranking tables!
For my fellow mortality stat geeks, I will put the details at the end of this post, plus the spreadsheets.
Highest level: top ten causes of death
The headline result is that COVID dropped to number 4 in the ranking list of top 10 causes of death.
So that you can compare, my ranking list has 2018-2022.
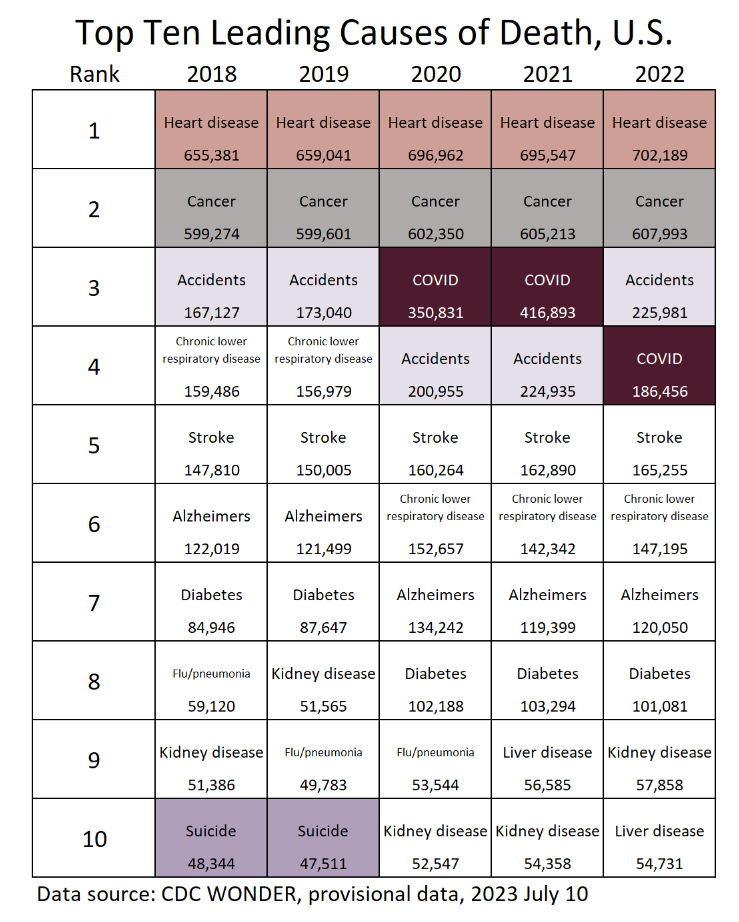
Just looking at the numbers, you can see heart disease, cancer, and accident deaths increased in 2022 compared to 2021.
COVID deaths decreased greatly compared to 2021 and even 2020.
Let us break this out by age groups to see what is going on.
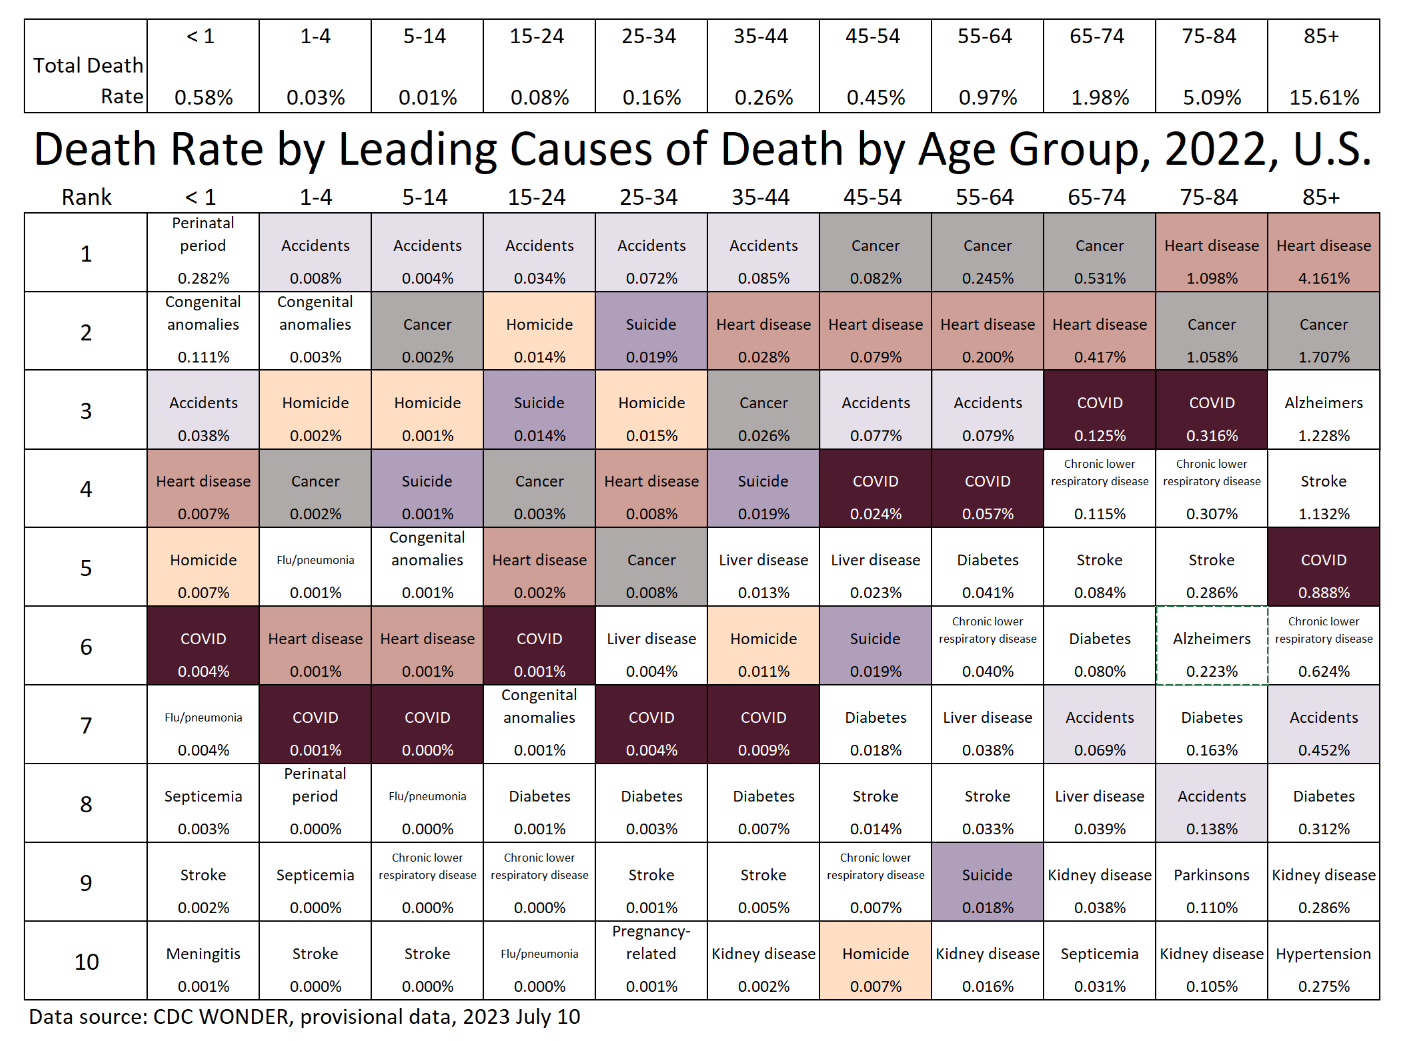
Top Causes of Death by Age Group
Let’s look at the table for 2022.

That’s the count.
Cause of Death by Rates for 2022, U.S.
Yes, for normal mortality rates, we mortality nerds quote them per 100,000 people per year.
I’m using percentages here because I’m being ornery… but also because normal people use percentages.
People have a poor “gut feel” of very small and very large numbers unless they work with them often.
Obviously, the squares where you see 0.000% as the death rate, really aren’t zero. But they are very small, and may as well be zero. If you look at the table above, with actual counts, it’s fewer than 100 deaths… in a country of over 330 million people.
A note on “accidents” — I don’t like this category of “rankable” deaths, but I’m using it for this post, because this is the standard list of “rankable causes of death”.
“Accidents” includes a bunch of different kinds of deaths: motor vehicle accidents, drug overdoses, falls (especially of the elderly), drowning, animal attacks, all sorts of things!
In separate posts, when I look at mortality trends in specific age groupings (children, young adults, middle-aged adults, seniors), I split out these accidents, because the different natures are important.
Prior Ranking Tables
If you want to look at prior years’ ranking tables by age to compare, this is where you should look:
2021: Top Causes of Death by Age Group, 2021: Finalized U.S. Stats – this actually has 2019 and 2020 as well
2020: Top Causes of Death by Age Group, 2020: Raw Numbers and Top Causes of Death by Age Group, 2020: Death Rates
2017: Mortality with Meep: Baseline U.S. Mortality Stats for Comparison
I didn’t make the chart for 2017, where they use the term “Unintentional Injury” instead of “Accidents”. It’s the same category.
You will also notice they do something different for the under age 1 category (that is, infant mortality… which I have yet to deal with, because it’s difficult).
Method Comments and Spreadsheets
I downloaded the data from CDC WONDER provisional mortality database today, 10 July 2023. The ranking is using the UCD – ICD-10 113 Cause List.
It looks like the population estimates have not been updated (the CDC uses Census estimates, but they didn’t use the most recent estimates I think), but I doubt it makes a huge difference for the death rates. It may for finalized rates, but there may be changes for the final attributed cause of death as well, so I’m not going to worry about it now.
The main item was that external causes of death (homicide, suicide, accidents) are censored for 6 months as a matter of course, which is why I had to wait for the July update to make these tables. The final numbers may be different, but they will likely be close.
Related Posts
Young Adult Mortality Trends, 1999-2021 (provisional), Ages 18-39 -- The Recent Millennial Massacre (Part 1)
Literal Suicide and Media
A Sampling of Political Mortality
