Public Pensions Issues: Volatility Kills
by meep
There are a few big issues feeding into public pension underfundedness. Obviously, many plans aren’t contributing the amounts their own actuaries calculate they are supposed to. There are issues with what’s going on with the benefits.
But for now, let’s focus on the asset side.
This is going to be long on excerpting and graphs, low on the explanation.
BLAST FROM THE PAST: PLANS SHOULD BE OVERFUNDED NOW
Pension myths from Girard Miller, formerly of Governing Magazine:
As I have explained in one of my very first Governing columns in late 2007 (when the last business cycle was peaking), a fully funded pension plan must today have market-value assets of 125 percent of current accrued actuarial liabilities near the peak of an average business cycle — in order to offset the near-certain loss of stock market values in the following recession. Historically, that is because the 14 recessions since 1926 (including the most recent) have shrunk equity values by 30 percent on average, and equity investments represent about two-thirds of the average public pension funds’ portfolio. Real-time pension funding ratios will therefore likely decline by about 20 percent in the average recession, depending on how much the bond portfolio offsets the stock losses and mounting liabilities. So there is not a major public pension plan in the United States today that can be described as “overfunded.”
Now, it looks like the cycle may have peaked, but my question is: are there any pensions near 125% funded right now?
Let’s check it out at the Public Plans Database.
For fiscal year 2015, here are all the plans with over 100% fundedness:
DC Police & Fire 107.6%
Washington LEOFF Plan 2 107%
South Dakota RS 100%
I find that straight 100% for the last a bit suspicious.
Now, not all plans have their 2015 numbers in the database. Let’s look at 2014:
DC Police & Fire 107.3%
Washington LEOFF Plan 2 107%
South Dakota RS 100%
Wisconsin Retirement System 100%
Yeah, I’m definitely suspicious of those 100%s.
WHAT’S ONE DOWN YEAR?
One down year can be deadly, that’s what.
A piece from MarketWatch explains the effect of discount rates and one bad investment year:
The Chicago Tribune recently wrote about how the decision to reduce the expected-return assumption from 7.5% to 7.0% for the Illinois Teachers Retirement System resulted in the governor calling for approximately $400 million in additional taxes.
While the political positioning behind this small move of 0.5 percentage point is fascinating, it more importantly brings to the forefront the issue of how large future obligations are, and why there is a lot of fear and an incentive to hide.
….
But investments don’t return 7% year-in, year-out. For simplicity, let’s assume the long-term horizon to be 10 years. Even if there is one year where returns are negative-20%, this results in an asset value that is over $20 billion lower (see illustration below).

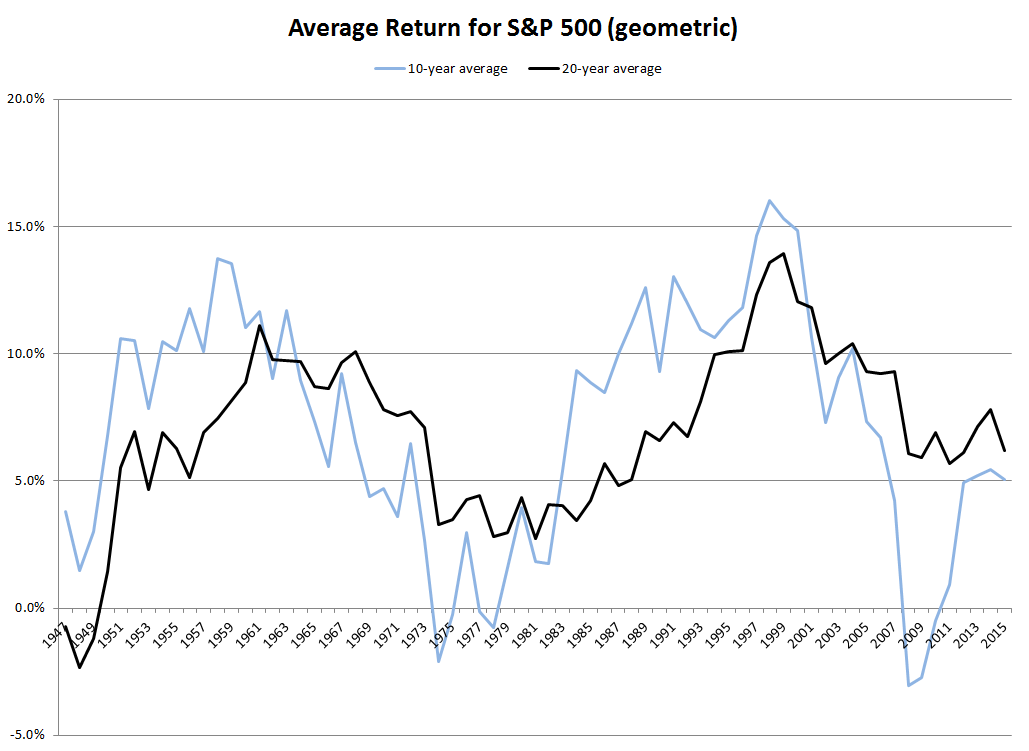
Forget about theory, what about actual history? I did some graphs of 10-year and 20-year rolling average returns for the S&P 500 (geometric averages, natch).

Mmmm. Note that the late 70s/early 80s had worse averages than now, if we’re looking at the 20-year average.
SMOOTHING THE TROUBLES AWAY DOESN’T GET RID OF THE TROUBLE
Fitch Ratings has a warning for pensions that amortize too much:
The chances of a near-term improvement in funded ratios for many state-wide pension systems are remote, Fitch Ratings says, even as annual pension contributions made by state governments continue to rise. In particular, state systems that employ 30-year rolling amortization or similar methods to calculate their annual required contributions (ARC) are at greater risk of having pension sustainability problems over the long run.
…..
Inadequate contributions relative to the ARC are not the only weak contribution practice. In many cases, a system’s ARC itself is a poor benchmark of contribution adequacy. The ARC is a product of multiple, separate assumptions reflecting the disparate policy priorities of each system. These priorities include cost stability, equity and certainty of achieving full funding. For many systems, progress in achieving full funding is sacrificed for short-term cost stability. This is particularly true for major systems employing 30-year rolling amortization or other amortization assumptions that create a similar outcome.Under a 30-year rolling amortization, the ARC is an inadequate measure of contribution sufficiency because at each successive annual funding valuation the ARC is recalculated based on a new 30-year open period, much like refinancing a home mortgage loan year after year. The resulting ARC is likely to provide a higher degree of contribution stability at a lower cost than if it were calculated based on more conservative, alternative methods, such as a consistently fixed, closed-period amortization, various layered amortization approaches, or even a shorter rolling period, such as over 20-years.
Yes.
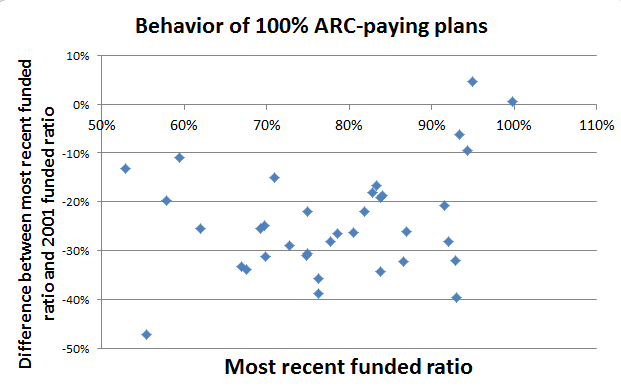
Maybe that explains this graph:

So many plans paying 100% ARC and even after 15 years can’t improve. Perhaps this amortization is behind that. I’ll have to look.
But the point is that the volatility in the assets is real, and the lack of volatility in the liabilities while the assets are volatile…. is troublesome.
Volatility kills.
We’ll see how much in some illustrative posts later.
Related Posts
Requesting a Public Hearing on Public Pension Actuarial Practice
Wisconsin Wednesday: Is Contribution Growth Moderate?
Public Pension Returns Start to Roll In for FY 2022
