Taxing Tuesday: Idea for Progressive Income Tax in Illinois; Adding Dependents to Tax Change Analysis
by meep
Today takes on an Illinois flavor, looking at one bright idea from the folks in Springfield.
AKA, raise taxes on almost everybody.
Sounds like a winner.
Here is one person’s argument for a progressive tax: Gauen: ‘Progressive’ income tax may be hot topic in Illinois campaign
Illinois has a “flat” state personal income tax, currently 4.95 percent. After deductions or other adjustments, you pay 4.95 percent of your income — whether you earned $10,000 or $10 million.
….
All but one of the Democrats running for Illinois governor have advocated for some kind of progressive tax. Most lack specifics so far. The idea presumably would be to set high brackets to reap extra taxes from the relatively wealthy, without affecting the middle class.That concept contrasts with Missouri, which has 11 brackets, all aimed at extremely low income levels. There is no distinction between the middle class and the rich, taxing all income over $9,001 at the top rate of 6 percent.
I’m having an issue interpreting this.
Let me go to the Tax Foundation for details: Facts and Figures 2018: How Does Your State Compare?
Mo. (a, b, c) 1.5% > $101
2.0% > $1,008
2.5% > $2,016
3.0% > $3,024
3.5% > $4,032
4.0% > $5,040
4.5% > $6,048
5.0% > $7,056
5.5% > $8,064
5.9% > $9,072
….
(a) These states allow some or all of federal income tax paid to be deducted from state taxable income.(b) Local income taxes are excluded. Fourteen states have county- or city-level income taxes; the average rate within each jurisdiction is: 0.5% in Alabama; 0.63% in Delaware; 1.56% in Indiana; 0.45% in Iowa; <0.01% in Kansas; 2.08% in Kentucky; 2.89% in Maryland; 1.70% in Michigan; 0.5% in Missouri; 0.50% in New Jersey; 1.94% in New York; 2.25% in Ohio; 0.37% in Oregon; and 2.95% in Pennsylvania. Average local rates are from the Tax Foundation, 2018 State Business Tax Climate Index.
© 2017 brackets due to data availability.
Huh. Weird state.
Let’s check Missouri vs. Illinois on per capita tax collections (state & local income tax):
Table 14.
State & Local Individual Income Tax Collections per Capita Fiscal Year 2015Ill. $1,237 13
Mo. $1,025 27
Okay, that’s on a par. How about when we throw all the taxes in?
Table 6.
State & Local Tax Collections per Capita
Fiscal Year 2015Ill. $5,742 12
Mo. $3,644 41
Hmmm.
An argument against a progressive income tax for Illinois: False promises, real harm: Why Illinoisans should reject a progressive income tax | Illinois Policy
With Illinoisans already shouldering a record $5 billion income tax hike passed in 2017 – which still could not keep up with Springfield’s spending demands – many state lawmakers are trying to justify further tax hikes without drawing the ire of the voting public.
How? By calling for a progressive income tax. Some members of the Illinois General Assembly, as well as many Democratic gubernatorial candidates, have been pushing the idea of scrapping Illinois’ constitutionally protected flat income tax in favor of a progressive income tax that would make “the rich” pay their “fair share.”
Proponents of scrapping this constitutional protection make three key claims regarding a progressive income tax: it would reduce taxes on the middle class, it would go a long way toward reducing income inequality and it would benefit the state’s economy.
Key graph:
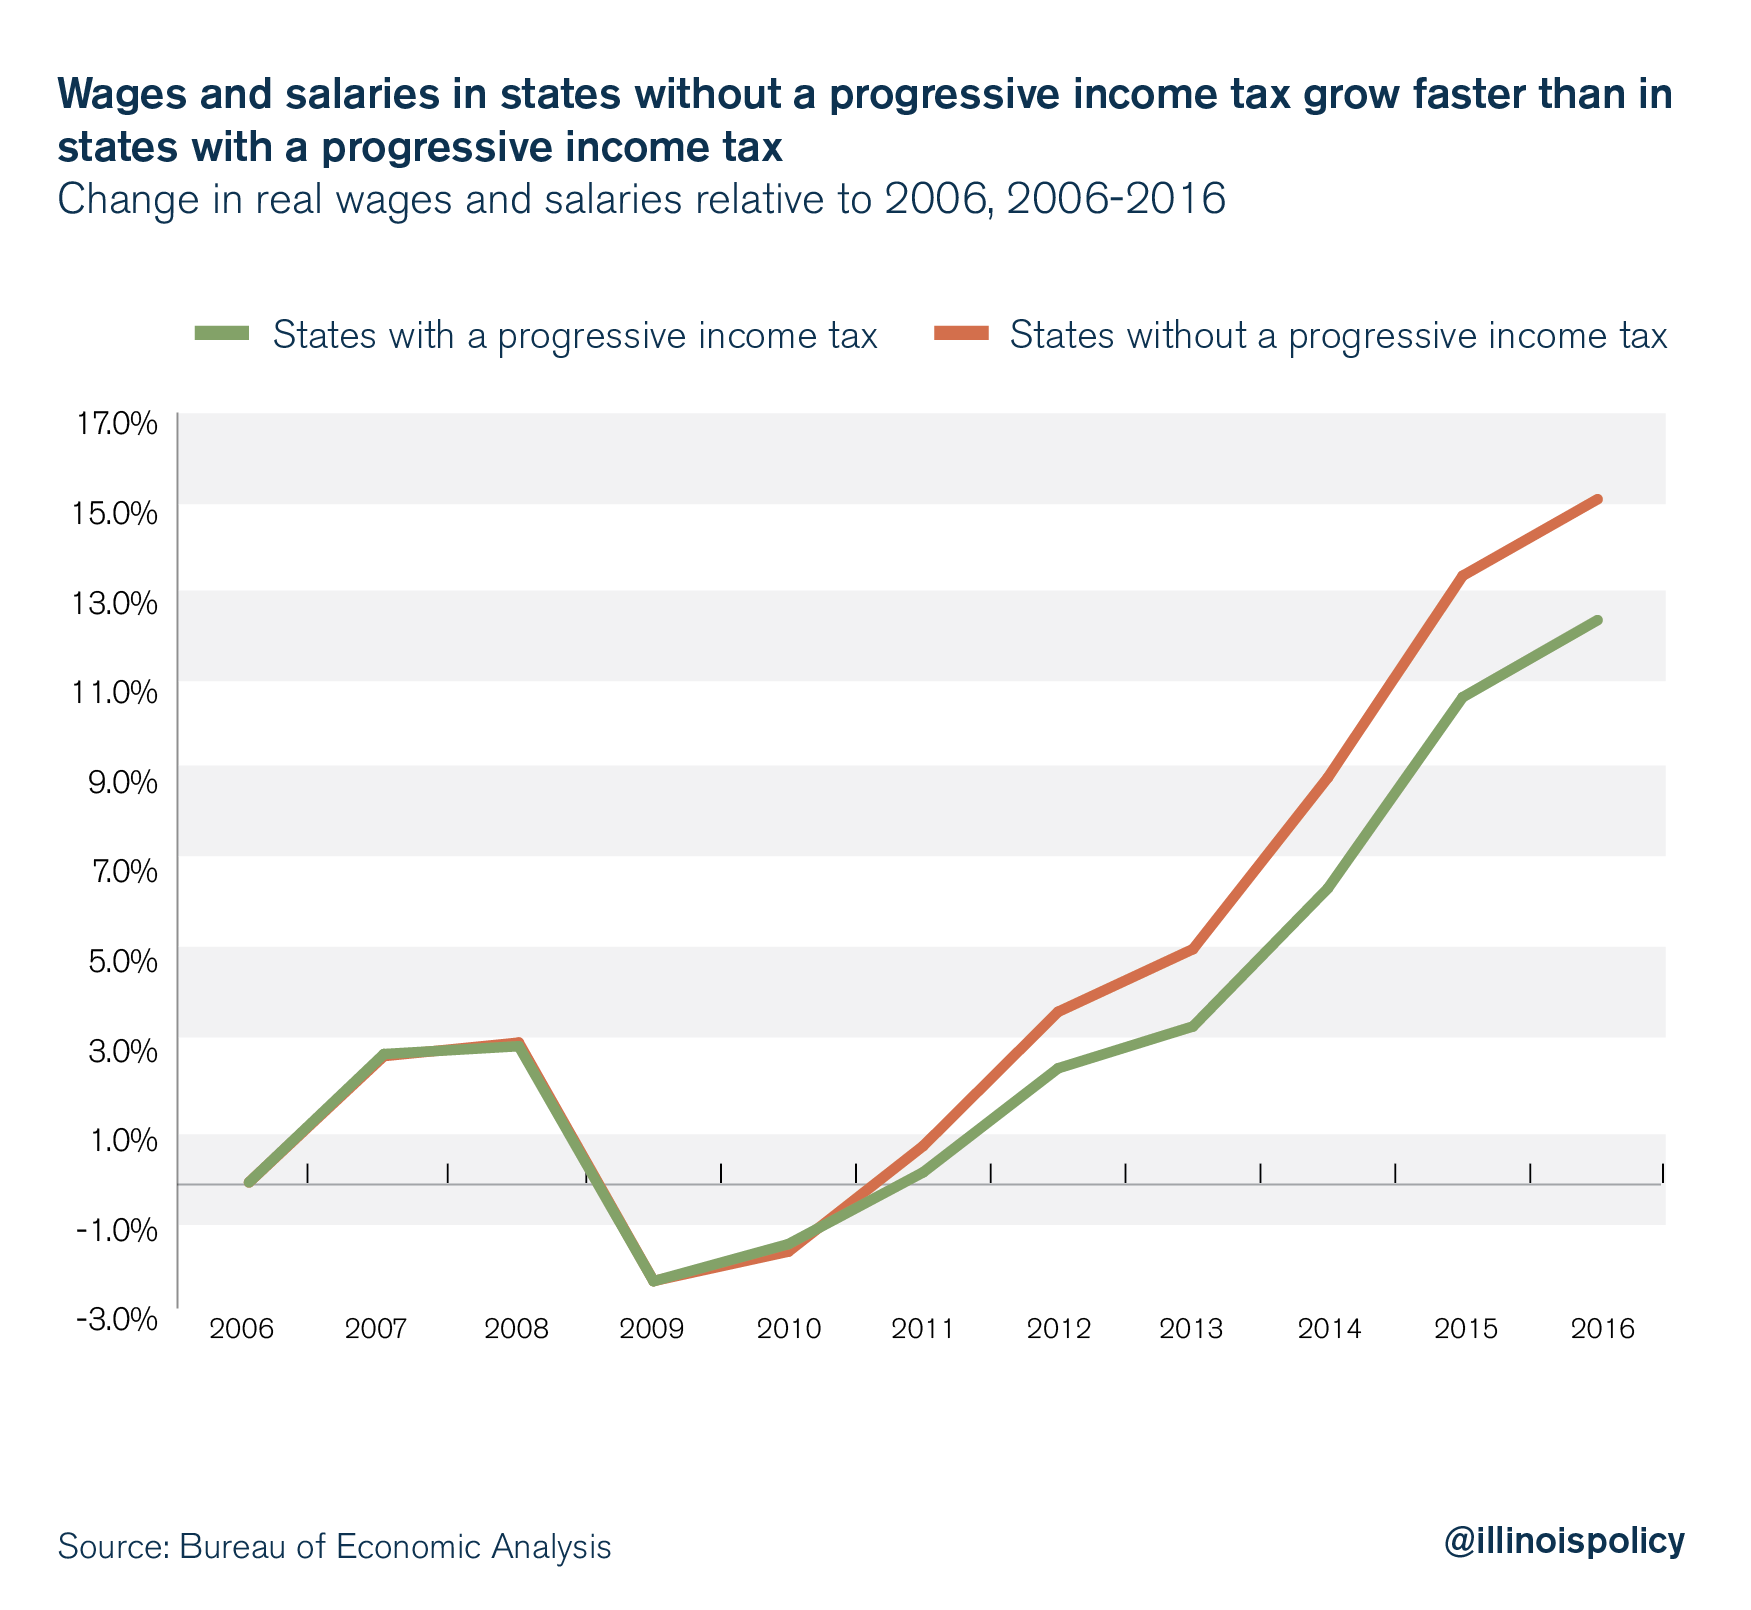
They also have an analysis which shows that everybody’s taxes would need to be increased.
When progressive tax proposals such as Daiber’s fail to generate necessary revenue, income tax rates on the middle class are bound to go up, just as they have in New York.
Thanks for reminding me.
PRE-PAID TAXES COUNT FOR 2017
It’s a little late in the tax season to tell people this, but whatever:
Treasury allows Illinois residents to deduct prepaid property taxes
The Treasury Department said this week that residents of Illinois who prepaid property taxes last year should be able to deduct them.
The department issued this clarification in a letter to Rep. Peter Roskam (R-Ill.), a senior member of the House Ways and Means Committee whose district includes suburbs of Chicago.
“This announcement is a win for the thousands of Sixth District residents who stood in line to prepay their property taxes last year,” said Roskam, who is in a competitive reelection race. “As we move forward with an updated new tax code, families in every income bracket will see a tax cut and Illinois residents will see real tax relief.”
…..
The IRS issued an advisory shortly after the tax law was signed that said people could deduct prepaid 2018 property taxes only if the taxes were both assessed and paid in 2017.The guidance created some confusion, including in Illinois. In that state, taxpayers pay property taxes for the previous year, so taxpayers prepaying property taxes at the end of 2017 were prepaying 2017 taxes, not 2018 taxes.
Roskam wrote a letter to the Treasury Department seeking clarification that the IRS advisory did not pertain to prepayments of 2017 property taxes, and the Treasury Department agreed.
I “pre-paid” taxes, but that wasn’t accurate. The tax payment wasn’t due until January 31, 2018… but I got the bill in September 2017. So it wasn’t really a prepayment. I paid it before the due date… and before the end of the year.
TAX SIMULATIONS: ADDING CHILD DEPENDENTS
I’m not yet adding in married couples. Let’s just keep to single filers, with dependent minors, and try out a few scenarios. Let’s do the combos done before… just with 1 child dependent.
I will do a single non-deceptive graph:
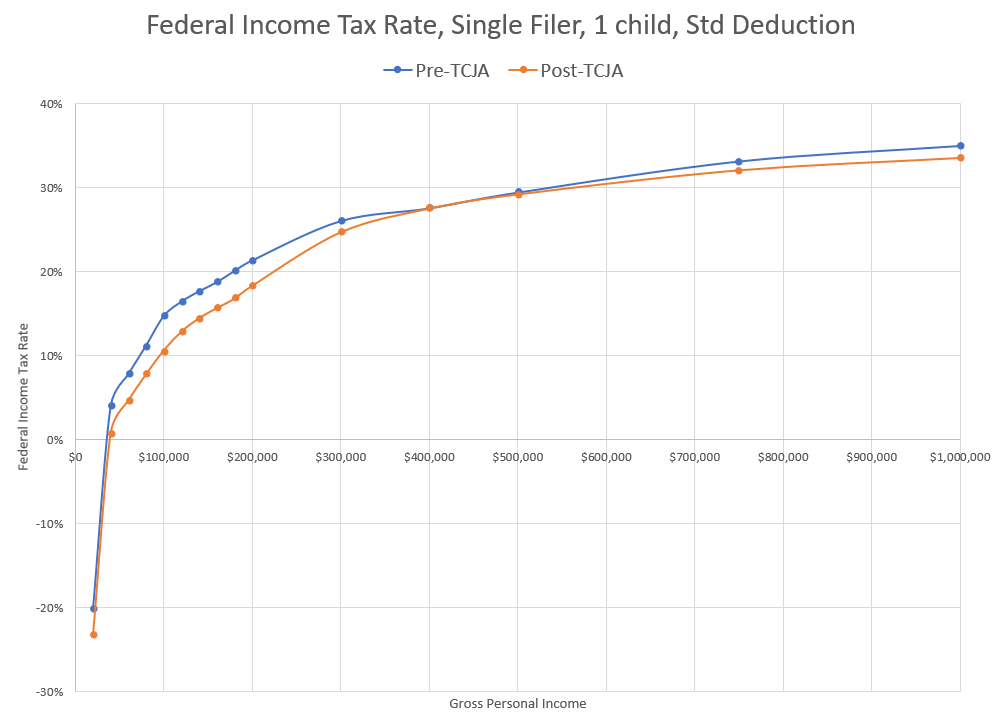
So we’ve got the general shape of our curves — In all cases, higher incomes pay higher taxes within any specific tax regime.
However, the steepness of this rate curve differs between the two regimes, and sometimes cross over each other — which is how some end up with tax increases in places that look odd.
All the remaining graphs will be before/after differences. Sometimes one ends up with weird-looking curves because the axes I’m using are exaggerating small differences (in percentage terms)
Remember: negative means the new bill cut your taxes, positive means it raised them.
Here’s the standard deduction differences:
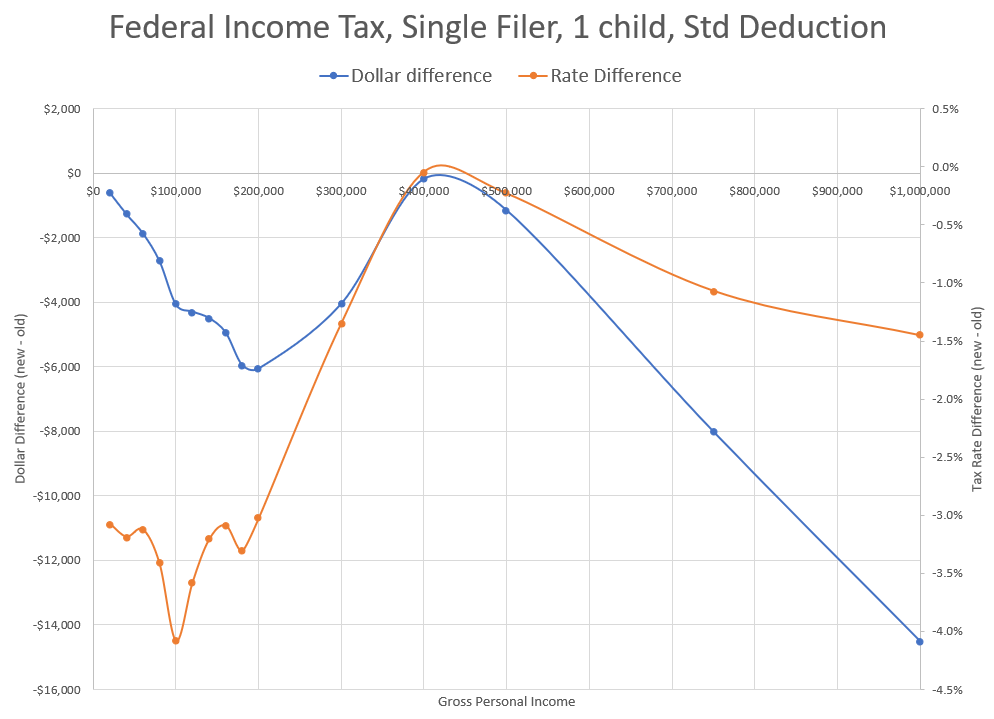
That never actually peaks above 0 – that’s an artifact of the splines used in drawing a smooth graph by Excel.
Let’s try the $20K property taxes:
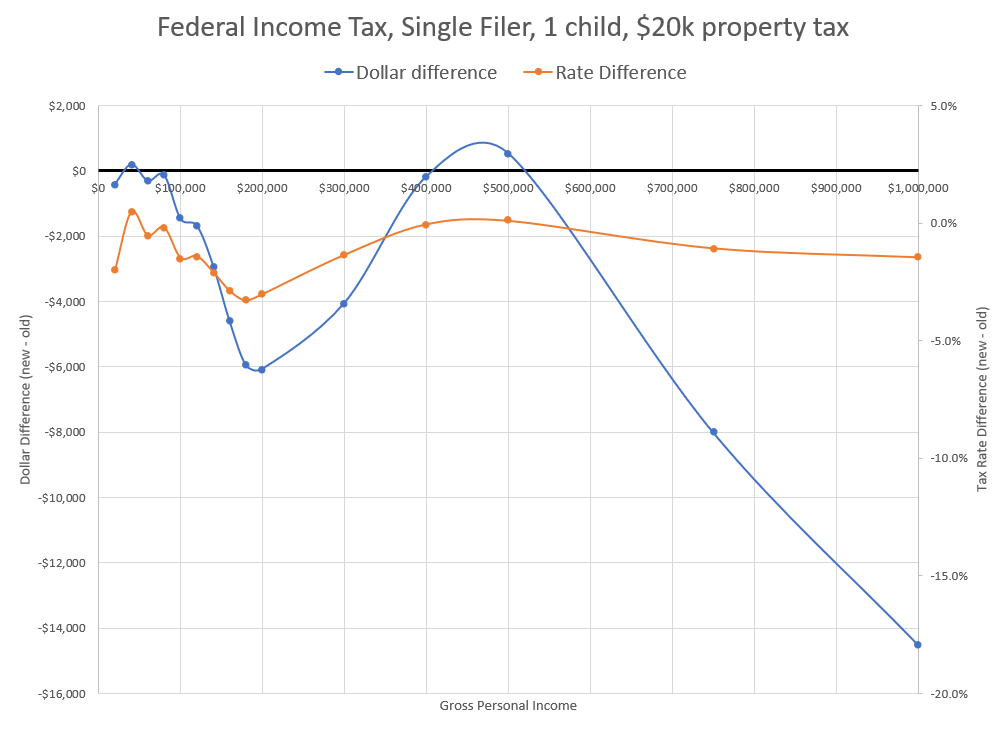
I didn’t fix the vertical axes on that, but you can see for $500K there are very slight increases in tax paid.
5% state income tax:
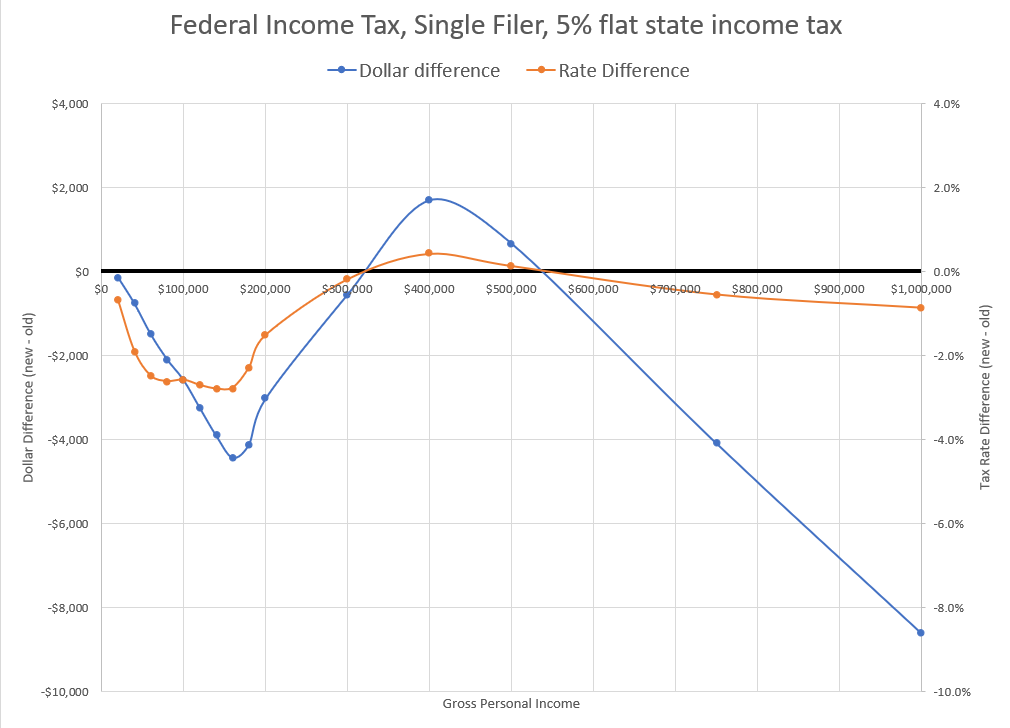
Again, the $400K – $500K scenarios pay slightly higher taxes.
10% state income tax:
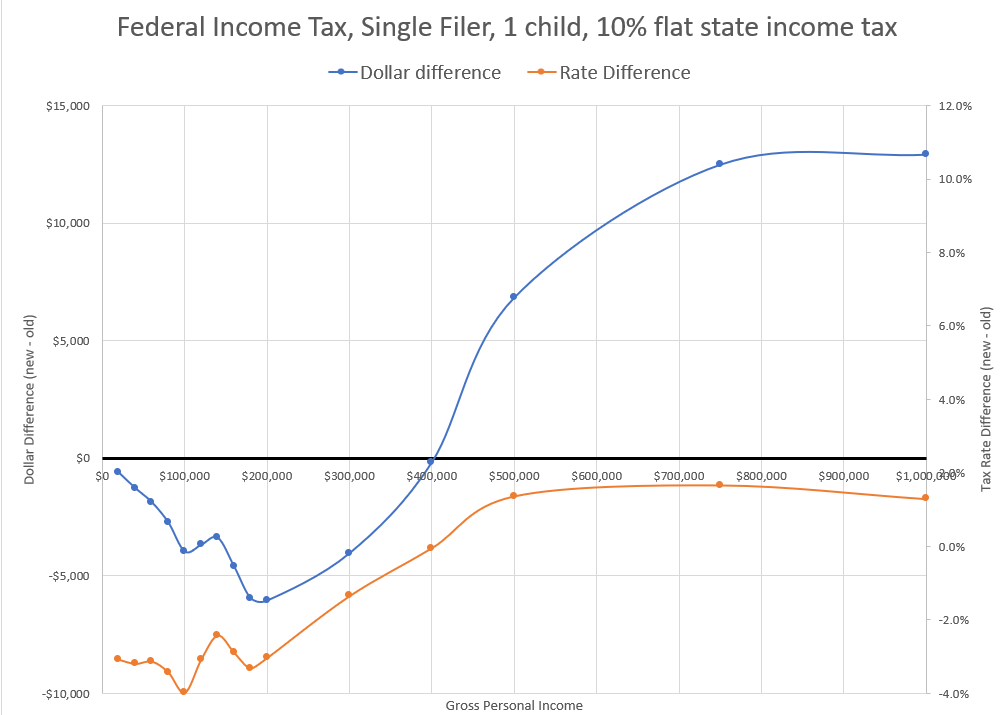
And now we’re seeing a bit into the much much higher income levels.
I did some more combos in the spreadsheet (linked below), but they don’t behave all that differently. And these are very wide scenarios to grab at the ones who get a hit. Not that many people are booking $400K in income, are single filers, and have one child dependent. Sure, there may be a few, but generally at that income level a whole bunch of things will be going on.
It’s when we start getting a bit more real — with state income taxes AND local property taxes AND children AND married…. well, we’ll see in the future scenario tests. When you’ve got more going to states in state income tax than federal income tax… well, you can see why the high tax states are jealous.
Here’s the spreadsheet with results.
Play with it a bit yourself:
