Taxing Tuesday: A Promise to Raise Taxes, Who is Paying Most Taxes, And Who Gets the Cuts?
by meep
Okay, again, I’m a bit tired, so I’m keeping this short, and am not trying out my own scenarios this time.
DEMOCRATS 2018 ISSUE: LET’S RAISE TAXES
You know what? Not being snarky — I’m glad they’re being clear here.
Oh wait, that’s somebody else being clear about intentions, not necessarily the Democrats.
Democrats: Give Us the House so We Can Raise Your Taxes
In addition to their multiple calls for greater gun control, Democrats have found another message they believe is a winner for the 2018 midterms. They want to repeal the GOP tax cuts. They can’t stand the idea of people being allowed to keep more of their own money.
Some tweets:
We have a rigged tax code that has essentially legalized tax dodging for large corporations. It's time to repeal the Trump tax breaks for the wealthy and large corporations and rebuild the disappearing middle class. #TaxDay
— Bernie Sanders (@SenSanders) April 17, 2018
The Republican tax bill gives 83% of its benefits to the Top 1%. That'd be bad enough. But there's more in there to hurt workers. It incentivizes corporations to outsource jobs. pic.twitter.com/WWpzKt2nB9
— Rep. Keith Ellison (@keithellison) April 17, 2018
Hmmm, top 1% gets 83% of the “benefits”?
I wonder how much in taxes the top 1% pay.
THE TOP 20% TO PAY 87% OF INDIVIDUAL FEDERAL INCOME TAXES
Top 20% of Americans Will Pay 87% of Income Tax – WSJ
Households with $150,000 or more in income make up 52% of total income nationally but pay large portion of total taxes
One of the least discussed parts of America’s income tax is how progressive it is, and the tax overhaul didn’t change that fact. In 2018, top earners will pay a higher share of income taxes.
The individual income tax matters—a lot—*because it is the largest single source of U.S. revenue*. And its share has risen in recent years. For 2018, it could raise 50% of total federal revenue, according to estimates from Congress’s Joint Committee on Taxation, up from about 48% last year.
Hmm, that’s not top 1%, though. Let’s check elsewhere.
BOTTOM 46% PAY NO FEDERAL INCOME TAXES
46% of Americans pay no federal income tax — here’s why
Approximately 80.6 million or 46% of Americans won’t pay any federal income tax, up from 76.4 million people before President Trump’s Tax Cuts and Jobs Act, according to data from the Tax Policy Center, a nonprofit joint venture by the Urban Institute and Brookings Institution, which are both Washington, D.C.-based think tanks. That’s below the 50% peak during the Great Recession. They still obviously pay sales tax, property taxes and other taxes.
And, importantly, payroll taxes. Many of the people in the 80.6 million, though, aren’t paying payroll taxes because they’re not employed — they’re retired, or they’re students, or they just don’t work for whatever reason.
All but the top 20% of American families pay more in payroll taxes than in federal income taxes, according to Treasury Department data, cited by the Pew Research Center. “After all federal taxes are factored in, the U.S. tax system as a whole is progressive, according to Pew. “The top 0.1% of families pay the equivalent of 39.2% and the bottom 20% have negative tax rates. That is, they get more money back from the government in the form of refundable tax credits than they pay in taxes.”
On the other hand, payroll taxes are mildly regressive, Burtless said. “Individual earners do not pay any additional Social Security payroll taxes on earnings above $127,200 per year (in 2018),” he said. “The implication is that federal taxes overall are progressive, but they are far less progressive than the federal individual income tax system viewed all by itself.”
That’s a big ole duh.
Still not giving me the 1%, though. Let’s dig some more.
TOP 1% PAY ALMOST 40% INDIVIDUAL FEDERAL INCOME TAX
This is from before the tax law was passed.
The individual income tax is designed to be progressive – those with higher incomes pay at higher rates. A Pew Research Center analysis of IRS data from 2015, the most recent available, shows that taxpayers with incomes of $200,000 or more paid well over half (58.8%) of federal income taxes, though they accounted for only 4.5% of all returns filed (6.8% of all taxable returns).
By contrast, taxpayers with incomes below $30,000 filed nearly 44% of all returns but paid just 1.4% of all federal income tax – in fact, two-thirds of the nearly 66 million returns filed by people in that lowest income tier owed no tax at all. (The IRS tax data used here are estimates based on a stratified probability sample of all returns.)
And using this graphic:
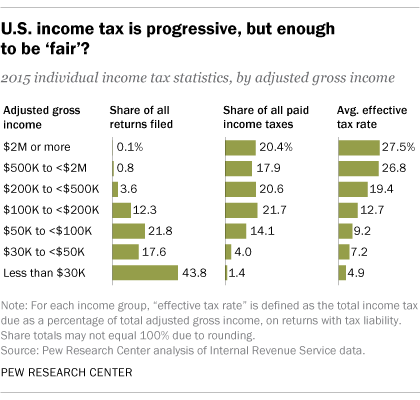
It looks like the top 0.9% of returns in 2015 represented 38.3% of federal income tax paid. There ya go.
That was from Pew, and here is the same info from The Tax Foundation:
The share of reported income earned by the top 1 percent of taxpayers rose slightly to 20.7 percent in 2015. Their share of federal individual income taxes fell slightly, to 39.0 percent.
In 2015, the top 50 percent of all taxpayers paid 97.2 percent of all individual income taxes while the bottom 50 percent paid the remaining 2.8 percent.
The top 1 percent paid a greater share of individual income taxes (39.0 percent) than the bottom 90 percent combined (29.4 percent).
The top 1 percent of taxpayers paid a 27.1 percent individual income tax rate, which is more than seven times higher than taxpayers in the bottom 50 percent (3.6 percent).
It’s kind of hard to give tax cuts to those who aren’t paying those taxes. Yes, there’s the Earned Income Tax Credit (aka negative income taxes), but the point remains.

REMIND ME AGAIN: WHO GOT A TAX CUT?
As I said, I’m not doing my own scenarios today. Luckily, the Tax Foundation did a bunch months ago.
Here’s their handy-dandy chart:

In these scenarios, all of the people received tax cuts, some bigger than others, obviously. The highest cut, percentage-wise, was for the single parent with 2 kids, earning $52K/year. He got a 36% cut compared to prior taxes, or a 3.64% cut compared to his income.
If you look at the dollar amount of the cuts, the largest cut was for the couple earning $2 million per year. That’s well above the 1% of filers. However, if you look at their percentage reduction, it’s only a 3% decrease in their taxes (or 0.95% compared to their income).
And they’re still paying more than everybody else in the chart.
Now, they didn’t put in the percentages for each scenario, in terms of effective tax rate. I will do that now. I will reorder them so that they’re in order of increasing income:

Remember: left to right goes from lower to higher income. So the one point really out of place is Amber — who is a single earner, no kids, with a 7% retirement contribution using the standard deduction. And note: even before the TCJA, Amber was paying more than the three scenarios to her right: Kavya and Nick have slightly higher income but also two kids; Sophia and Chad have over double the income, a higher percentage contribution to retirement and two kids; Soren and Linnea have even higher income, about a 11% retirement contribution, and 3 kids. The kids make a lot of difference.
Those receiving the least in cuts, percentage-wise, either have no kids or really high incomes.
Yes, I can do this on dollar amounts, but percentage amounts actually make more sense in terms of materiality. $1000 means a lot more to someone making $30,000 than it means to someone making $2,000,000.
No, the tax cuts are not evenly distributed, even on a percentage basis. Some higher-earning people pay lower rates… and they did before. If you want to get rid of any tax credit for dependent children to make it more fair, by all means, do so, Democrats.
Because removing the SALT cap does not make the system fairer. The problem for folks like Bernie & Nancy is that they’re heavily dinged under the new tax law, because they own multiple properties and pay a lot in property tax (at the very least). How dare the feds make them pay more in taxes!
I think the SALT cap should be 0, by the way. But $10K is a good start.
WHO WILL BE PAYING?
So the Tax Foundation looked at a handful of scenarios, all of which led to a reduction in federal income taxes. But I know I am able to at least come up with some scenarios where people will be paying higher taxes. Let’s go back to that Wall Street Journal article:

So we’re having the top 1% going from about 38% of income tax, up to 43%.
The top 0.1% alone (which includes the 1%), are going from about 19% to 22% of all the individual federal income tax collected.
And, mind you, some of the people in the 1%/0.1% are there for only one year, due to an event like selling a business or some other one-time activity. Ask the Obamas if they made millions of dollars in income every year, or just specific years where they were given large book contracts, as an example.
So, anyway, I hope taxes really are a theme this year, because I think a case can be made for higher taxes — but the case is not “That’s unfaaaaair!” when what they’re whining about is rather rich people having to pay more.
The problem is that Democrats pretty much have a lock on the states where the SALT cap is going to bite, so it’s not exactly going to win extra votes in, say, West Virginia to whine that some rich folks in other states may have to pay higher taxes.
OTHER LINKS
I don’t feel like commenting on these, but they all relate to the TCJA.
- Why Low-Tax States Could Come to Dislike the New Tax Law, Too
- How to Get Your Tax Weekend Back | Thoughts from the Frontline Investment Newsletter | Mauldin Economics
- The Cost of “The Resistance”: For CA, It’s $12 Billion | Power Line
- Trump tax cut will increase tax for 1 million Californians | The Sacramento Bee
- Illinois House approves Trump tax-cap workaround
- Endowment Tax Could Affect Harvard’s Pension Investments | News | The Harvard Crimson
- Cap on the State and Local Tax Deduction Likely to Affect States Beyond New York and California
See y’all next week with more taxes!
Related Posts
Taxing Thursday: It's Up to You, New York, New York
Federal Tax Avoidance Follies: A Splash of Reality
Taxing Tuesday: Are People Moving Due to Taxes?
