Mortality with Meep: the Society of Actuaries Studies 2020 Excess Mortality, Life Expectancy Rebuttal, and More
by meep
If you like keeping up with mortality news, check out the mortality category on Actuarial News.
I’ve picked out a few of these recent stories that you may also find interesting.
Society of Actuaries Report on 2020 U.S. Excess Mortality
The Society of Actuaries has been putting out a lot of research related to COVID this past year. Note that some of the research is specifically related to impact on insurers.
Last week, they published a study of general population excess mortality for the U.S.
I made a couple of videos on the study (so far):
Overview on the results:
How to trend to get baseline mortality:
We will be looking at the 2020 and after mortality experience data for years, and I know I will get plenty of blog fodder out of it.
Life expectancy rebuttal…kind of
Peter B. Bach on Stat News: CDC estimated a one-year decline in life expectancy in 2020. Not so — try five days
The Centers for Disease Control and Prevention made headlines last week when it announced that Covid-19 had reduced the average life expectancy of Americans in 2020 by a full year. The news seemed to starkly illustrate the devastation wrought by our nation’s worst public health crisis in 100 years.
But there was a problem. The pandemic’s appalling toll could not have reduced life span by nearly that much. My own estimate is that when Covid-19’s ravages in 2020 are averaged across the country’s entire population, we each lost about five days of life.
The CDC’s mistake? It calculated life expectancy using an assumption that is assuredly wrong, which yielded a statistic that was certain to be misunderstood. That’s exactly the type of misstep the agency can’t afford to make. Not now, not after former President Trump’s relentless attacks on its credibility. Not after his advisers were caught altering and editing the agency’s monthly reports to downplay the pandemic.
The CDC didn’t make a mistake, nor was it trying to be misleading.
I looked at the author’s info — he’s a physician. He is obviously not used to looking at CDC mortality stats, and EVERY TIME they report on life expectancy, it’s calendar year, not cohort year, life expectancy.
(and no, we don’t measure life expectancy impact on all the people in a specific year – that generally is not a metric we use. Think about it — if you’re alive now, whether you’ve had COVID or not, you survived that period. Maybe COVID will have long-lasting health impacts for those who had it, and it would be meaningful to say something about life expectancy impact there, but seriously: either you died in 2020 or you didn’t. If you’ve survived to 2021, your life expectancy as an individual wasn’t lowered going forward because some people died in 2020. So even his preferred metric is misleading.)
You can read the whole thing from Dr. Bach, and this is how he ends:
I have been wondering if the CDC should withdraw this report, explaining that it erred by disseminating a finding that was bound to be misunderstood. Yes, Covid-19 deniers will try to score cheap political points for a day or two. But at least for me, I don’t need an agency that is flawless, but one that is forthright.
Dr. Bach, every time the CDC releases updated mortality statistics, whether preliminary or final, they report a period life expectancy aka assuming that the mortality seen is seen by somebody since birth. It has never been the case that the period life expectancy is anything anybody actually experiences.
The whole point is to try to capture one period’s mortality rates (by age) in a single number; the other way is to calculate an age-adjusted death rate.
The problem with age-adjusted death rates is that there is no standard age distribution that you adjust by. You pick a year as your reference point, and weight all the other years you’re measuring by that distribution. You can end up with lots of different age-adjusted death rates depending on how you weight the different ages.
As for me, I don’t like collapsing mortality trends into a single number per year. I like separating out mortality trends by age and sex, at the very least. Age is the largest driver in mortality differences, and there’s a whole shape of how different ages have had mortality improvement in history, and those improvements have had all sorts of repercussions.
Related posts:
Mortality with Meep: Digging into CDC report on mortality in the first half of 2020
Mortality with Meep: Cohort vs. Period Mortality Tables
Meep digression: the shape of mortality
The first big improvement in the U.S. was in child mortality in the early 20th century — public health measures helped all ages, but the youngest the most. Then antibiotics and more and more vaccines improved mortality across the board, with children and young adults getting the most benefits. Improved auto safety and more stringent drunk driving laws helped all ages, but young adults the most (because they were the most idiotic drivers). We’ve seen improvements in middle age into old age due to reduced smoking and improved medical treatments — people who used to get their first heart attack in their 50s now see their first heart attack in their 70s… and it’s a lot less fatal now. And we’ve had amazing improvement in mortality at older ages.
It is very tempting to write a book about all the mortality trends we’ve got going on. The CDC has the data. They’ve issued reports on it. But few people really want to think about death. I’ll add it to my ever-expanding list of project ideas… (hey, Actuarial News was an idea for me for over a year… and now it’s here!)
Latin American mortality “paradox”
I have mentioned this before — the mortality rates for Hispanics (whether white or black or other) are lower than non-Hispanic whites in the U.S. There have been all sorts of explanations, one of which I had gone with: a difference in the numerator (counting Hispanics when they died – which may be based on what the medical examiner goes with; and may be based on last name) and the denominator (counting living Hispanics, which is based on self-identifying Hispanics).
But maybe there really is a lower mortality rate for Hispanics.
U.S. News & World Report: The Latino Health Paradox Goes Beyond U.S. Borders
Researchers from the National Institutes of Health analyzed some 22 million deaths among people 20 to 64 years old between 2001 and 2015 in the U.S., Argentina, Belize, Brazil, Chile, Colombia, Cuba, Ecuador, Mexico, Nicaragua, Panama, Peru and Uruguay. They split people in the U.S. into four groups: whites, Africans Americans, Latinos and Puerto Ricans.
Researchers found the rate of premature death among women from six major causes – circulatory, respiratory or digestive diseases; endocrine disorders such as diabetes; tumors; and external causes like assaults and accidental deaths – was lower in most of the Latin American countries and among U.S. Latinas than among white and African American women in the U.S.
So, they picked specific causes of death for this study, but these are among the main causes of death at various ages in the U.S.
I do wonder why they didn’t simply use all-cause mortality. I would start with that (as all-cause mortality is supposedly lower for U.S. Hispanics compared to non-Hispanic whites and blacks). Then I would start digging into specific causes of death.
The academic paper is here: Trends in Premature Deaths Among Adults in the United States and Latin America
I do have an issue with the characterization of “premature deaths”. A lot of the causes they chose in that list aren’t exactly “premature” if you can’t prevent the causes (I happen to have Type 1 diabetes in my extended family; I have yet to hear how to prevent that.) How can you prevent cancerous tumors? For certain types of cancers, sure, but many — they’re just bad luck, as far as we know.
That said, they did give an additional theory for the “paradox”: Hispanic/Latino immigrants would be healthier than the general populations they came from. That’s good, except most Hispanics in the U.S. are native-born currently. The healthy immigrant theory would work for all sorts of immigrant groups, but it doesn’t last til the next generation.
Here is a graph:
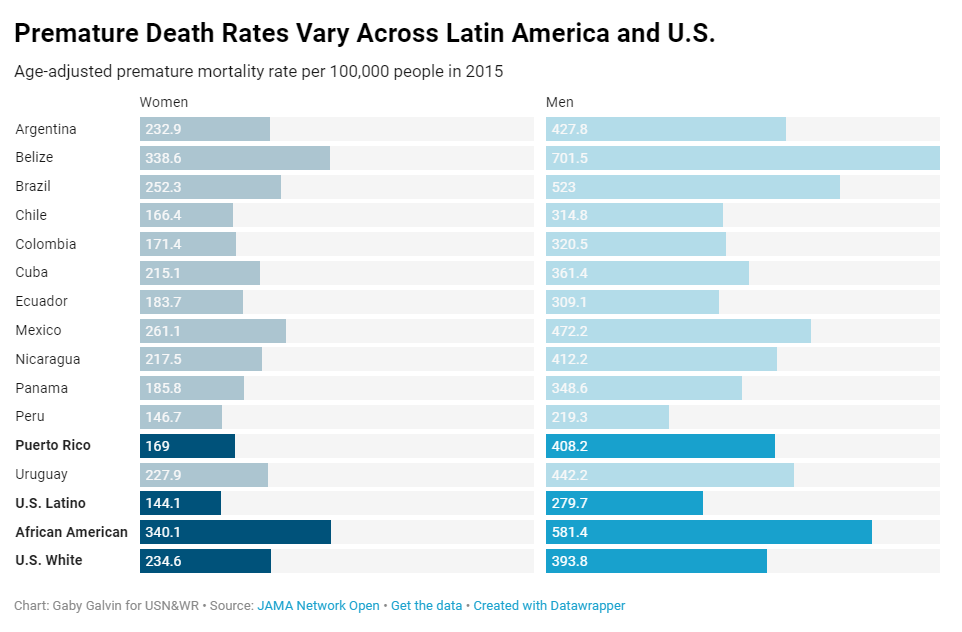
The main thing I want to note from that graph: the mortality rate they show is about twice for males compared to females, for the same ethnic/national group.
There is a much bigger effect in mortality from sex than from race. Isn’t that interesting?
(And what the heck, men in Belize?)
All the mortality news you desire!
To plug the site once again, here is the mortality category on Actuarial News.
Just a little over a month, and I’ve already got 155 entries for the category!
Yes, most of it is COVID-related, but here is a handful of non-COVID mortality-related pieces:
- County-level data on U.S. opioid distributions, demographics, healthcare supply, and healthcare access
- ‘The Genome Odyssey’ Review: From Code to Clinic
- America is experiencing the worst recorded increase in its national murder rate
- The Question Some Company Owners Don’t Want to Deal With – key person life insurance
- More people died on Illinois roads last year than since 2007. Is the pandemic to blame? – I SWEAR don’t ask me about car accident deaths being recorded as COVID deaths
- Assessing mortality inequality in the US: What can be said about the future?
- Officials Pledged to Address Rising Black Suicides in Chicago. Six Months On, There’s Still No Plan.
I’m sorry, there’s really no happy stories in there… okay, I have one happy story: pediatric flu deaths are at an all-time low:
Flu activity is ‘unusually low’ in the US: Can we keep it going in future years?
Some 136 people were hospitalized for the flu between Oct. 1, 2020, and Jan. 16, 2021, and there were 292 deaths involving influenza during that period, the CDC reported. One child has died.
Yes, it is sad when any child dies from a preventable disease, but this is amazing. Grabbing the FluView tracker for pediatric flu deaths:

Check that out — the single pediatric flu death, looks to be in December 2020. In the prior three flu seasons, there were pediatric flu deaths per season ranging from 144 to 195.
Grab the happy mortality stories where you can.
Related Posts
Mortality Angle of the Russian/Ukrainian Conflict: Bad Even Before Pandemic
Mortality Monday: Memorial Day and the U.S. Civil War
Drug Overdose Deaths, Part 2: Age-Related Trends 1999-2020 with Provisional Results in 2021
