Revisualizing the Financial State of the States: 2021 edition
by meep
Ah, the air has gotten a bit nippy, and it’s time to revisit what a mess most state finances are!
Truth in Accounting’s 2021 Financial State of the States
Here is their announcement video:
(some jazzy music for some not-so-happy results for most states)
And here are the relevant links:
Financial State of the States blog post landing (has an embedded document reader)
Full report in PDF form, all glorious 132 pages of it!
Truth in Accounting has been issuing this report going back to 2009. This will be important in a bit.
Interpreting the Financial State of the States
The measure being used: taxpayer burden or surplus. It’s a balance sheet perspective, where they’re looking at total debt and total assets, from a current value point of view, and then looking at the number on a per-taxpayer measure.
When they talk about pension debt or OPEB (other post-employment benefits, which is usually retiree healthcare), it’s not about the ultimate cost of these pensions, or all the future benefits that will be accrued, or anything like that. It’s using the states’ own measures of the retiree benefits, which is: value of benefits earned already, and discounted to now. If the states use a discount rate many people consider too high, it will make their pension & OPEB debt look smaller.
So, in many of the cases, I believe TIA’s measure understates the indebtedness of the states with respect to pension debt.
While others go through complicated exercises to make more “realistic” measures of pension/OPEB debt, TIA is taking the states’ own financial reporting and figuring out their total indebtedness.
It’s not TIA’s fault if the official financial reporting of the states can be misleading. (More on that can be seen here: Public Finance: Full Accrual Accounting and Governmental Accounting Standards Board Testimony )
The per-taxpayer interpretation of the debt (or surplus, should it exist) gives an idea of the financial strain a state has, from its promises to its own employees, from its bonds, from all sources of debt where the state is on the hook.
It’s not including all the lower levels of government, by the way (they do have a Financial State of the Cities report, which is newer).
No, we’re not expecting these “bills” to be paid all at once, any more than the credit card companies expect me to pay off my balances all at once. But the higher my total indebtedness, the more likely I am to have a financial squeeze.
Having an annual report, even when the numbers don’t move much year-to-year (and you’d better hope they don’t — it’s not a good sign when you have a very large movement in one year), can help you get a grasp on exactly how well different states are managing their finances.
Revisualizing the FSoS: Grading the States
Remember, in all of the following: black is good, red is bad. (The in-the-red meaning you owe money, in-the-black meaning you don’t owe). The redder something is, the more indebted the state; the blacker, the better!
The original map from TIA is this:
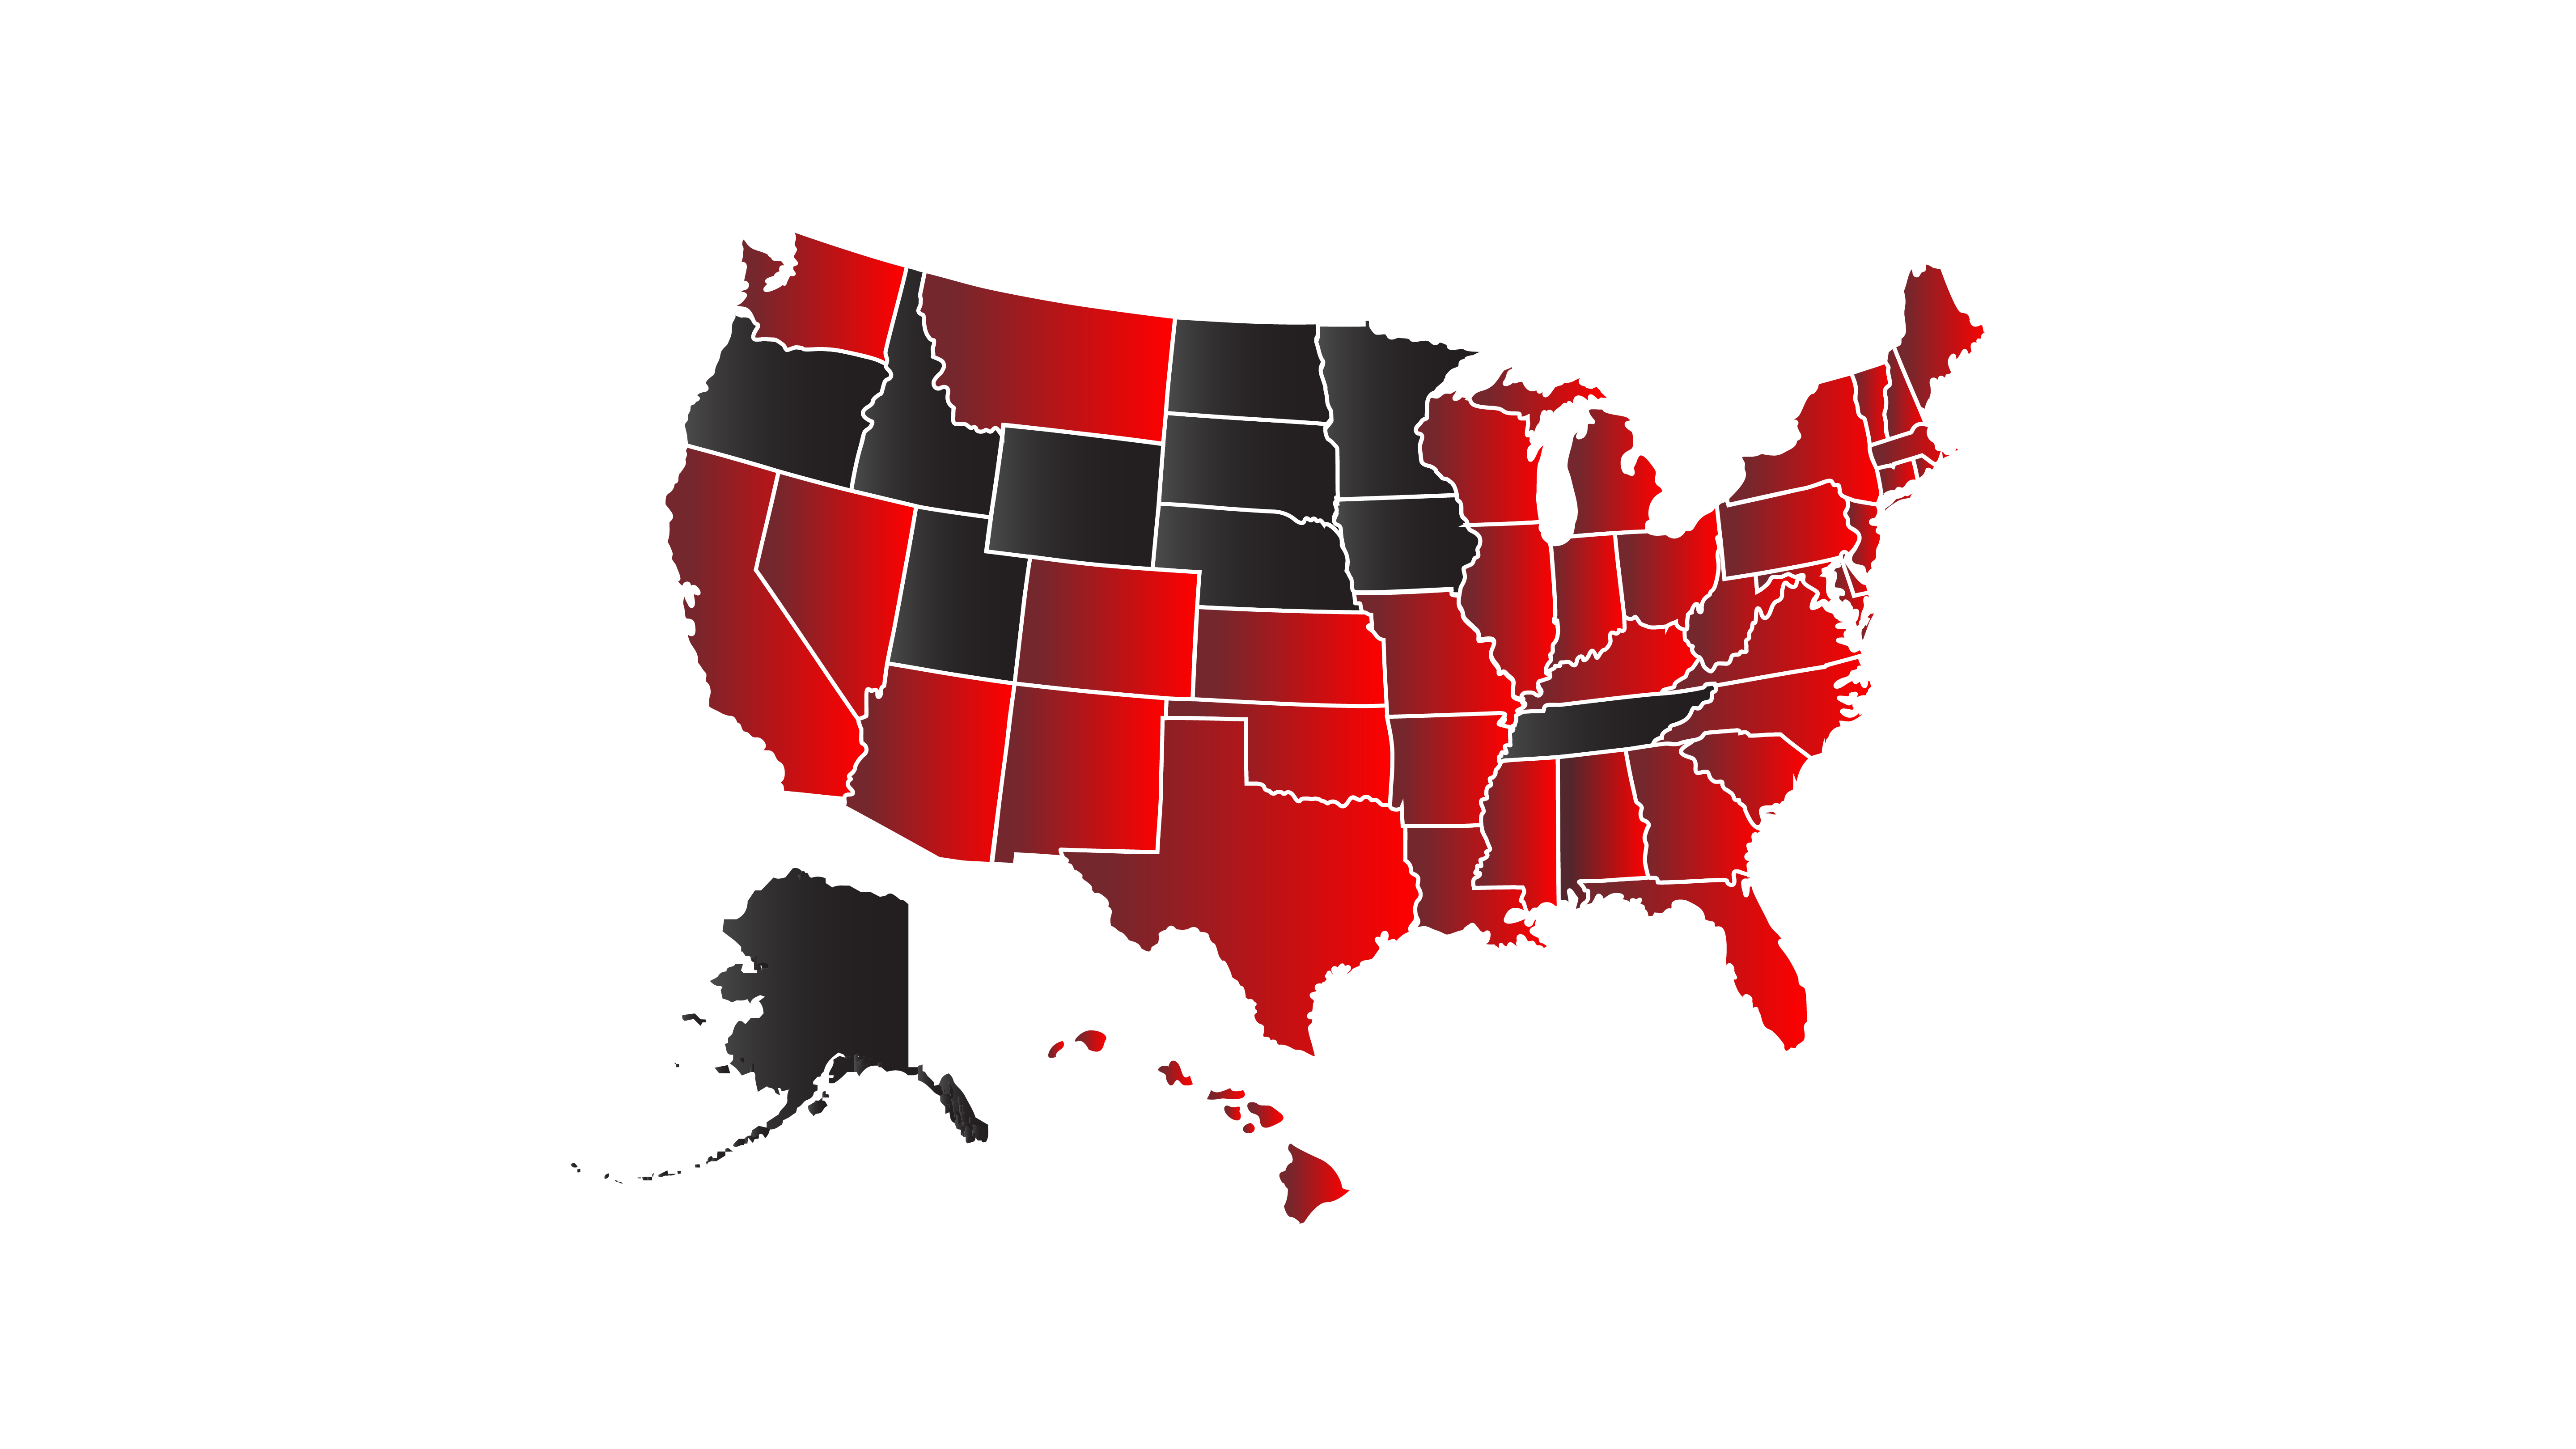
You can really see a geographical cluster, can’t you? But that just makes a distinction where there is a taxpayer surplus versus where there is a taxpayer deficit.
I used TIA’s own breakpoints in a tile grid map, so you can see how TIA graded the various states:
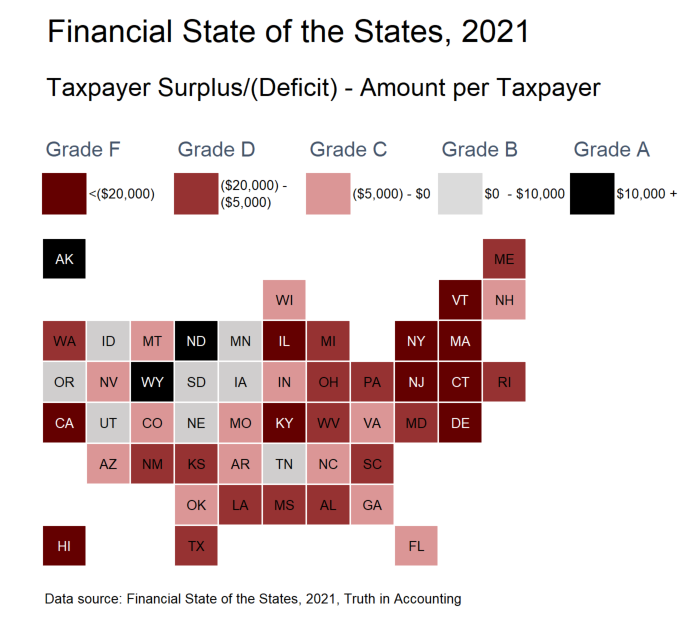
One large benefit of a tile grid map is you can see the geographically small states, which are often more obscured when you a geographically accurate map.
When viewed in this way, with the states colored by their grades, you can see that there’s a Northeastern Rogue’s Gallery, in addition to the expected stinkers of Illinois, Kentucky, and California (also, Hawaii, but many people don’t expect that one.)
But I want to point out that a lot of “red” states, in the political sense, also have crappy finances.
Texas is a particularly bad offender here, with a taxpayer deficit of -$13,100 per taxpayer. It’s not just the “expected” states where pensions are grossly underfunded — mind you, pretty much every single taxpayer sinkhole here has grossly underfunded state-level pensions — but it is a widespread problem.
So let us think consider the federal “bailout” of states passed in March of this year.
Bailout won’t fill the hole
As reported in the FSoS, the total state debt captured here is $1.5 trillion.
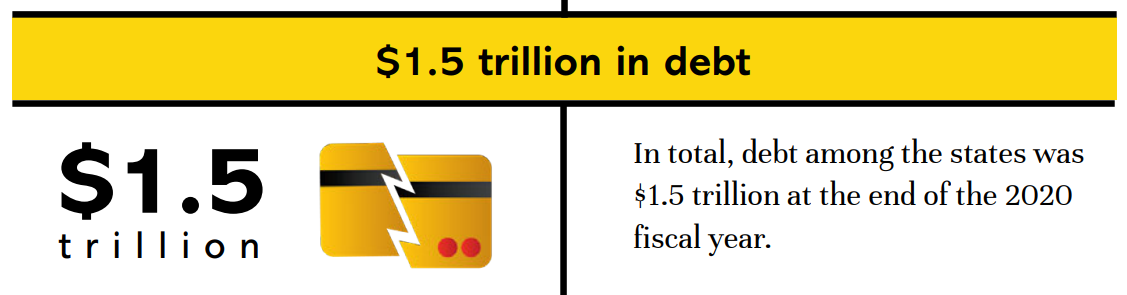
In last year’s report, the total debt was $1.4 trillion.
Just to order of magnitude, that’s less than a 10% increase, but still an increase.
Now, you may be thinking, wasn’t there some kind of federal bailout of states? It didn’t happen while Trump was president, but it sure passed in the Biden/Pelosi/Schumer era. It wouldn’t be in the financial year 2020 reports, but we can consider what may happen to the surplus or deficits in next year’s report, when the states get around to reporting their take.
The headline number on that federal bailout bill was $1.9 trillion, which included a variety of pieces. If it had all gone to the states, huzzah.
But “only” $195 billion was allocated to the states.
The American Rescue Plan provides $350 billion dollars in emergency funding for state, local, territorial, and Tribal governments to remedy this mismatch between rising costs and falling revenues. This includes:
$195 billion for states, (a minimum of $500 million for each State);
$130 billion for local governments (a minimum of $1.25 billion per state is provided by the statute inclusive of the amounts allocated to local governments within the state);
$20 billion for tribal governments; and
$4.5 billion for territories
Let’s look at how big $195 billion looks next to $1.5 trillion.
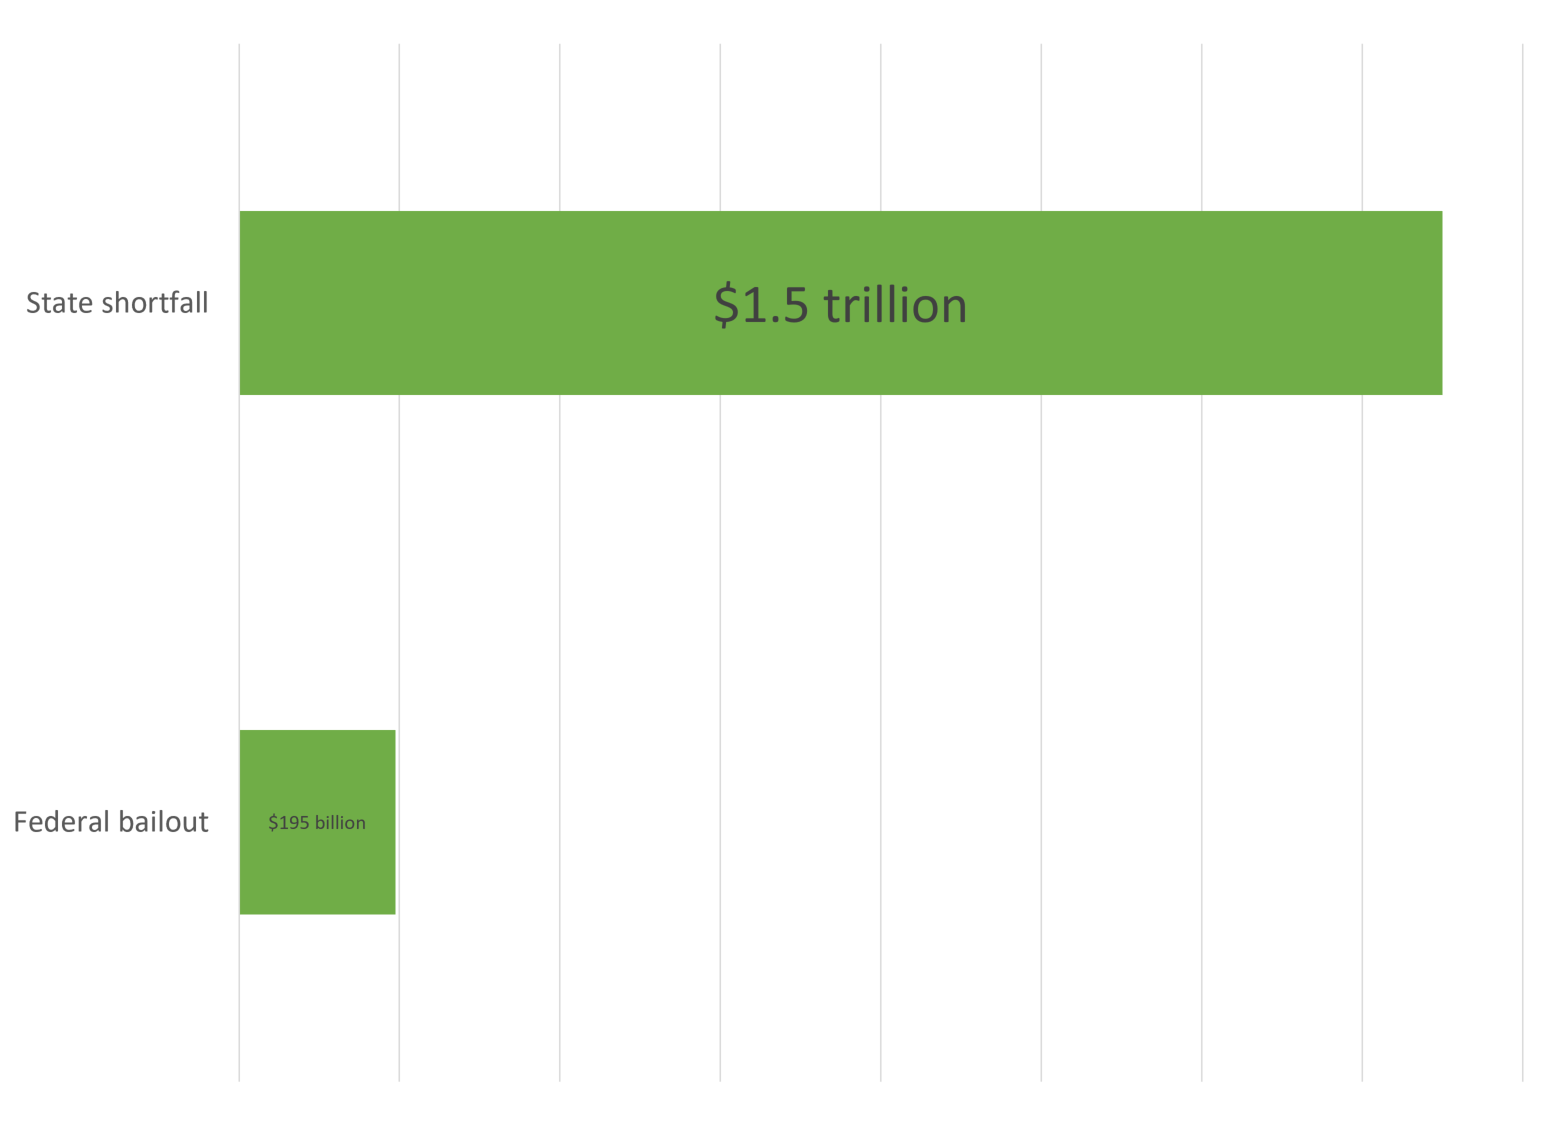
Yeah, it’s not all that much.
That said, it would go quite a ways in filling in the debt hole that states have.
What if there was a breakout of fiscal sanity among state-level politicians? Would that put me out of the public finance blogging business?
Worry not, public finance bloggers
I was concerned for all of two seconds when the federal bailout bill passed.
Once again defying Mayor Lori Lightfoot, Gov. JB Pritzker signed this bill, which will boost the pensions earned by some retired Chicago firefighters
— Heather Cherone (@HeatherCherone) April 5, 2021wttw</a><br><br>h/t <a href="https://twitter.com/AmandaVinicky?ref_src=twsrc%5Etfw">AmandaVinicky https://t.co/CBy1t8lqwf
Yes, that’s a city, not a state, but it was state politicians who decided to boost Chicago pensions. Chicago can’t afford this at all. It can’t afford the promises they already made, much let additional ones.
And then this:
A bill in the Massachusetts legislature to reward pandemic workers would add 3 extra years of service to their pensions when they retire, if they worked outside their home sometime between March-Dec. 2020. Do you think legislators & all public employees should be included?
— Pioneer Institute (@PioneerBoston) July 23, 2021
Is it any wonder how poorly-ranked Massachusetts is?
We ranked Massachusetts no. 47 for its fiscal health as a result of the state having $127 billion in bills and only $28 billion in available assets to pay those bills.https://t.co/Xg5MtFYraN
— Truth in Accounting (@truthinacct) September 28, 2021
Graphing the evolution of the worst states
I mentioned earlier that TIA’s State of the States reaches back to 2009, which is a good time to choose, given it was right after the Great Financial Crisis.
It doesn’t matter much the whole path from FY2009 to FY2021 — let’s look at the starting point to the end point. Not only do I label the states involved, but also the CAGR (compound annual growth rate) of the taxpayer deficit.
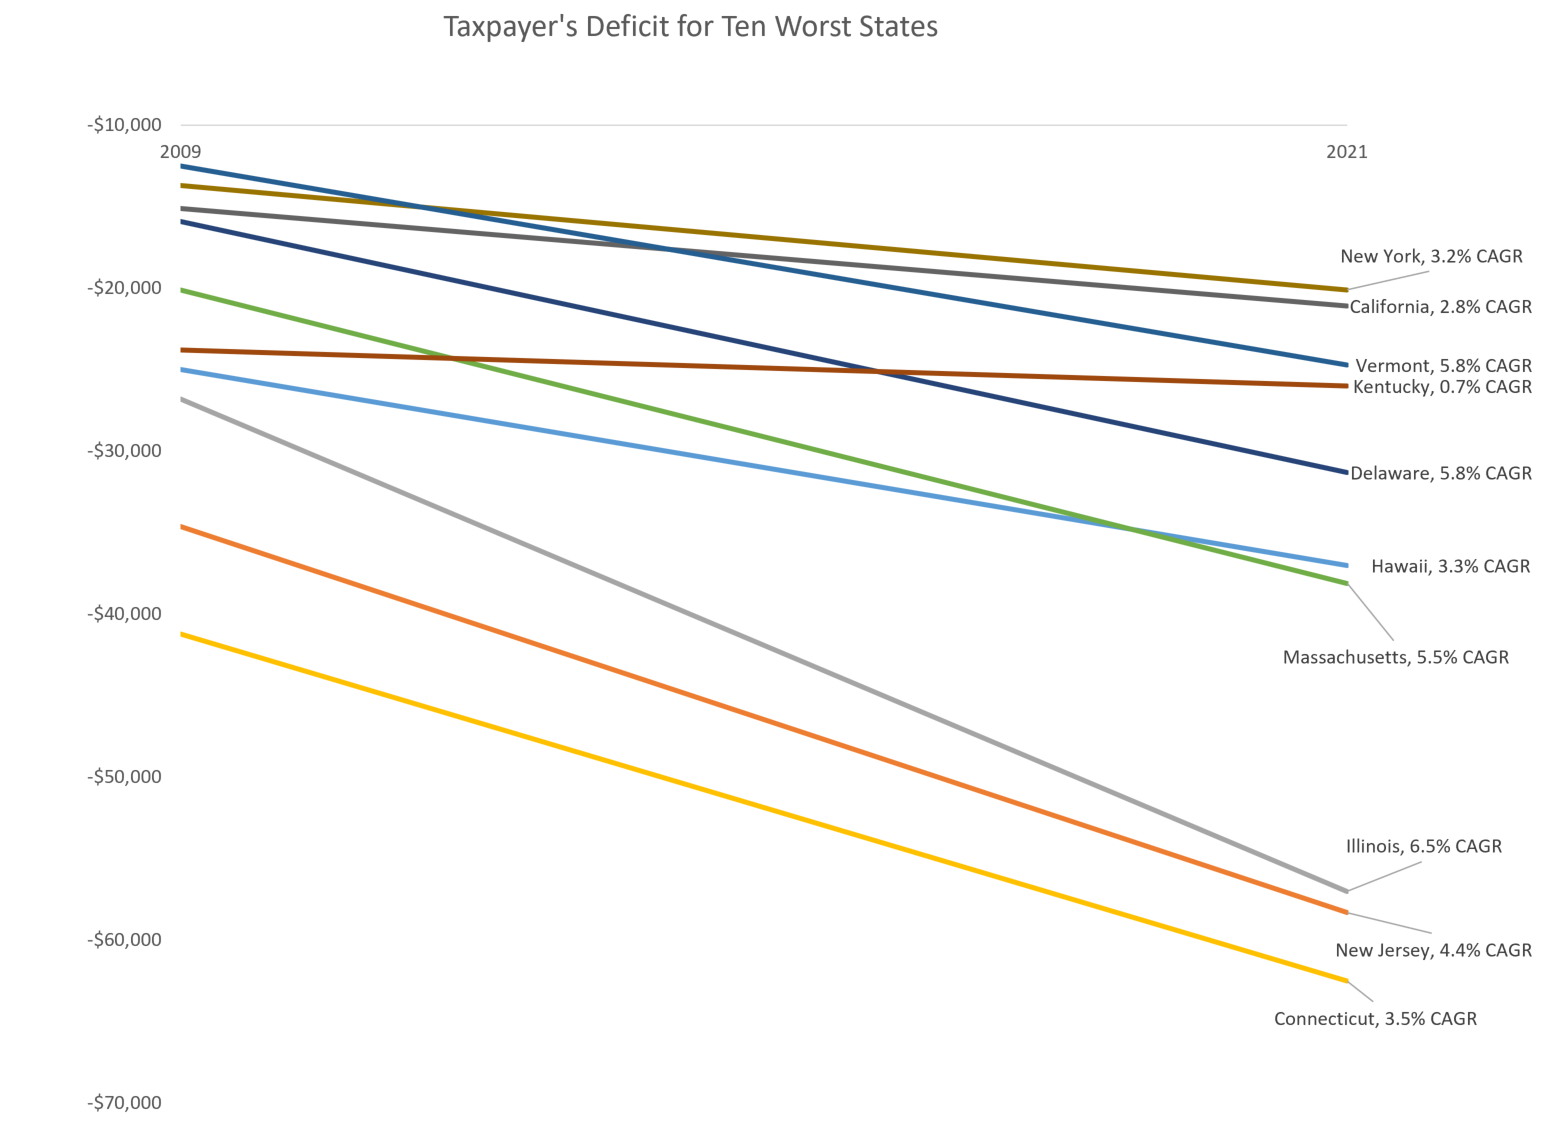
Something you need to see: for all of these states, the taxpayer burden has grown. If you are looking at a 4% per year growth rate in that burden, outstripping inflation, that is a 60% cumulative growth over a 12-year period. A 5% CAGR leads to a 80% cumulative growth over the same period. A 6% CAGR leads to doubling in 12 years.
Illinois had a 6.5% CAGR for the taxpayer burden from 2009 to 2021. It’s not getting better. At all.
This is not true for all states.
Graphing the states with the highest taxpayer surplus
Let’s see the trajectories of the top ten states:

This graph is only missing Minnesota in the group of 11 states that had taxpayer surpluses for the 2021 report.
I actually don’t like the look of Alaska, North Dakota, and Wyoming. Those surpluses are too high … I could say “Give it back!” re: the taxpayers, but I assume most of these asset values come from the value of natural resources, not from overtaxing their residents. These are low population states, very dependent on natural resources, and so will be very sensitive to changing population levels and changing energy prices.
But the other states in the list show far more modest improvements, and 6 of them dug themselves out of taxpayer deficits from 2009. So good for them!
Choices have consequences
This may be the age of bailouts, so there may be more federal money being shoved at states in the future.
But, as I’ve pointed out many times before, there are many public finance crunches hitting at the same time, all being driven by the same thing: slow demographic growth with an aging population. Even with deaths from COVID, we’re seeing the end of the Social Security Trust Fund in sight.
(It’s going to take a much bigger pandemic to “solve” the problem.)
The state indebtedness reflects decades of promises made, with a lack of pre-paying for those promises.
As can be seen from the long-term evolution of the state positions, some states made the decision to fill their holes, and other states decided to dig deeper. (There’s got to be a pony in there, somewhere!)
None of this is “bad luck” or chance. All of this was easily foreseen.
Maybe we will see a slight improvement for some of the states next year, as they absorb that $195 billion from the federal government, but as we can see above, some will just use it as an excuse to spend more and not pay down debt more.
That’s the easiest prediction I have ever made.
Related Posts
Taxing Tuesday: Is Illinois a Low Tax State?
Taxing Tuesday: No, Really, Surprise Money!
Taxing Tuesday: I'm Sure Suing the Feds will Really Work for New Jersey
