Top Causes of Death by Age Group, 2021: Finalized U.S. Stats
by meep
Huzzah! The CDC updated WONDER today, which means I’ll be moving forward with all sorts of items I had planned in response.
The first is the finalized ranking tables of cause of death for ten-year age groups, which I will give you in absolute counts as well as by rates (in percentages, because most people understand that better). I did a similar post for 2020 finalized ranking tables last year.
Top Causes of Death in 2021, Death Counts by Age Group, U.S.
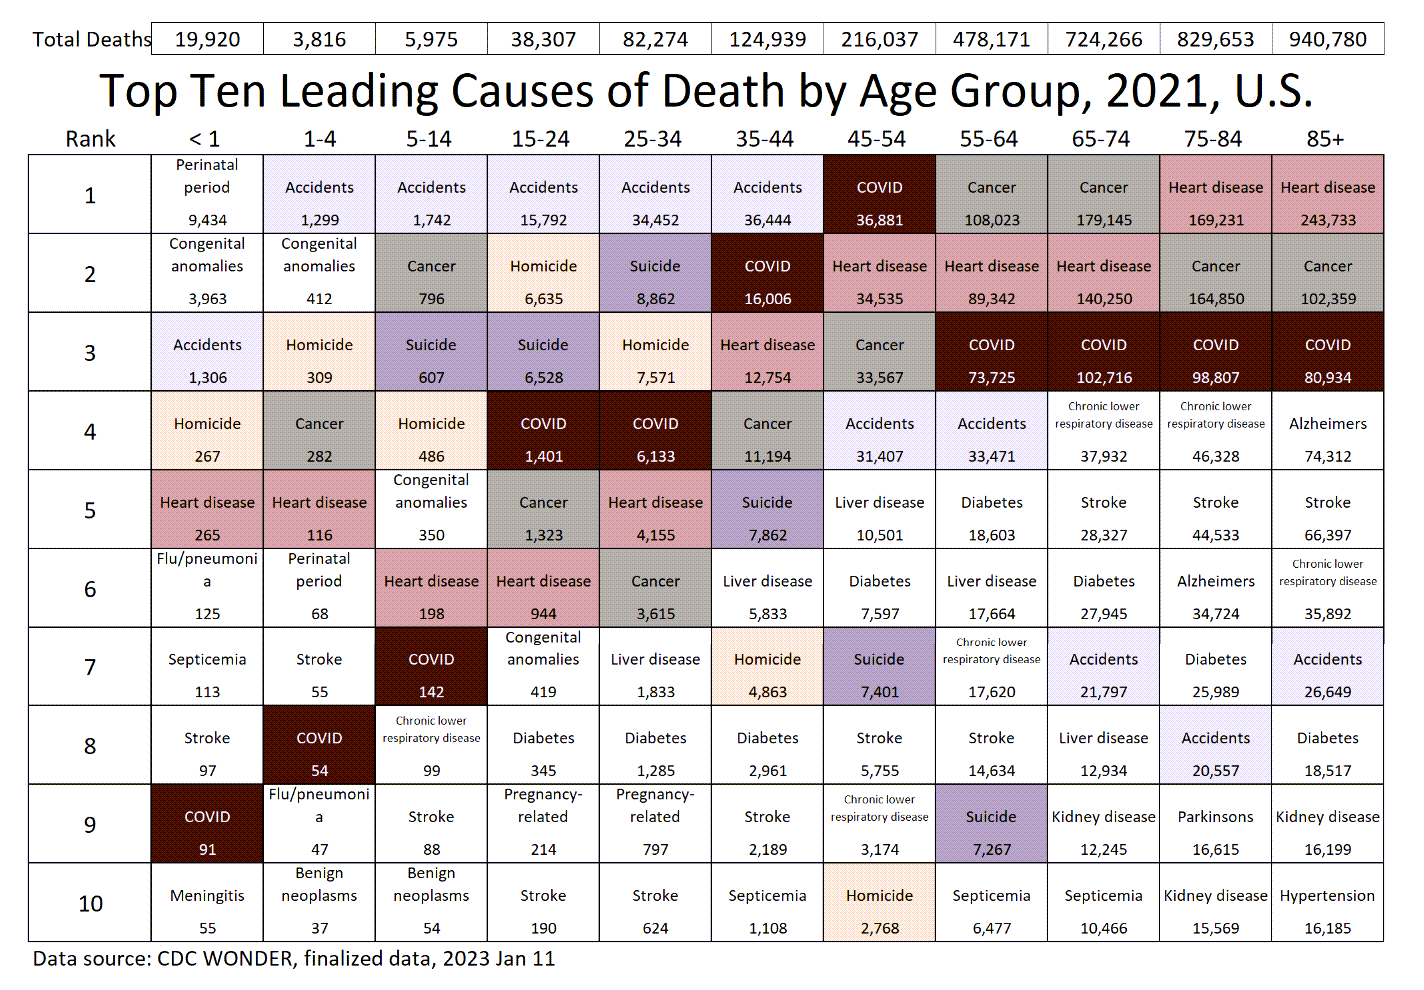
Back in July 2022, I did a provisional ranking table, and you will see the rankings are substantially the same, but if you look carefully a few items are more volatile in their counts than others.
Notably, the “external causes” of accidents, homicides, and suicides were most likely to increase by quite a bit, which is what I expected, as those are the types of deaths that tend to take the longest to resolve into the system, as I’ve explained many times.
COVID death counts for 2021, on the other hand, were pretty close by July 2022.
Something to remember for these ranking tables — and I’ll use COVID for my example — a cause of death can be top-ranked for one age group, but be less numerous than for an older age group (for which it’s lower-ranked). COVID was highest-ranked for the age 45-54 group, but, if we look to the age 55-64 group, it has more than twice the number of COVID deaths though it’s only third-ranked.
Ultimately, it’s not the absolute number of deaths I really use for analysis, though, but rates.
Top Causes of Death in 2021, Death Rates by Age Group, U.S.

Because of the discrete nature of rankings, all it takes is two extra deaths to shove a cause out of the way.
But the rates will be more stable.
For natural causes of death, there is a general pattern of increasing mortality with increasing age (though there’s an even more specific functional form to it). Not true of the external causes.
I will be doing more about the specific causes of death, especially with some 2022 data updates (I can do those very well for the natural causes of death, at any rate).
Cause of death ranking tables for 2019 and 2020, with rates
For the convenience of comparison, here are the finalized tables for 2019 and 2020.

The main thing to note for 2020 is that COVID was no higher than third-highest cause of death for any age group under age 85.
You have to get to age 85+ before you get to the second-highest cause of death… but that’s not where it landed in 2021. Isn’t that interesting?

You may wish to look between the tables – pick a cause of death, or pick an age grouping, and move between the three years to see how it changes.
I will be doing more posts using the finalized data (and what 2022 data I can) in the weeks to come.
Enjoy!
Methodology
Data were drawn from the CDC Wonder Database as of January 11, 2023, using finalized numbers for 2021, using the underlying cause of death database. Tables for 2020 and 2019 were done in prior years using similar procedures, and I link to where they originally appeared.
Cause of death categories for top leading causes were defined using the 113 cause of death list, using only the “rankable” causes (of which there are 51). I did not use the infant mortality cause list for those under age 1, because (sorry, not sorry), I am not interested in investigating infant mortality trends at this time. Those have their own complexities, unrelated to pandemic issues. I did pull that information, and realized it would make things more confusing, but that data is in the spreadsheet available for download.
Ten-year age groups were used for the groupings, as seen, for the entire U.S.; these are the standard groupings.
Death rates are presented as percentages — calculated as the number of deaths for the category divided by the estimated population for that age grouping. Population estimates for these rates are provided through WONDER.
If you are on the substack post, the spreadsheet with the table and graphs, and all the underlying numbers, are found below in the Excel spreadsheet. You can contact me if you have any questions about the numbers: marypat.campbell@gmail.com.
Suggested Citation: Centers for Disease Control and Prevention, National Center for Health Statistics. National Vital Statistics System, Mortality 2018-2021 on CDC WONDER Online Database, released in 2021. Data are from the Multiple Cause of Death Files, 2018-2021, as compiled from data provided by the 57 vital statistics jurisdictions through the Vital Statistics Cooperative Program. Accessed at http://wonder.cdc.gov/ucd-icd10-expanded.html on Jan 11, 2023.
I used the
Related Posts
2023 Summer Warning: Drowning Doesn't Look Like Drowning
Geeking Out: Public Pension Mortality Assumptions
Video: U.S. Mortality Through the Pandemic, part 2 -- Differences by State
