May Day Around the Web - Dataviz Follies
by meep
Happy Victims of Communism Day.
Let’s look at my top referrers this past week:
Speaking of Truth in Accounting, timehop reminded me of a blog post I made 5 years ago: Public Pension Primer: Discount Rate
I have been thinking of getting some of my basic explanations together, and write a Public Pensions Primer — not advocating any particular position, but just explaining major concepts in public pensions, with concrete examples, so people can see how all the numbers work.
Most of the guides out there seem to be advocating for something specific (like how POBs are awesome, as an example), or are way too technical. I would rather just explain what things are, and what tradeoffs there are.
I will probably use the Public Plans Database for some examples, but really, I want to use “toy” examples so it’s easier for people to see the cause-effect. Anyway, this is an idea in development for now.Instead of pension quicktakes, I’m just going to comment on some data visualizations that don’t work the way they think (in my opinion.)
SOCIAL CHANGE
This data visualization of social change has been making the facebook rounds

Yes, it shows how rapidly various trends can catch on across the U.S., but….. one of these things is not like the others. It has a very different pattern from the other lines, and even more so, there is crucial missing data.
Pssst, it’s the orange line, on alcohol prohibition. First, the line we can see goes up and down — the others do not.
Also, the others are “removing a ban” (that existed previously) and prohibition is adding one.
FINALLY, while there are still a few dry counties in the U.S., as far as I know there are no U.S. states which ban alcohol. Regulate, sure, but not prohibition. If the point of the graph is to indicate speed of change in the states, maybe they shouldn’t have put that specific line in… because it’s also a change that got undone.
Some of those other lines could also come undone.
Also, those animations in drawing the graphs was as annoying as Powerpoint animated transitions. Cut that shit out. It adds no information.
ACTUARIAL FOLLIES
The recent issue of “The Actuary”: had the following two graphics in an article on agricultural insurance:


The first graphic is ridiculous. Is there any good reason for detailing chicken anatomy? Are we training butchers here?
The second is ridiculous for a different reasons:
- the pie/donut-graph is a fakeout — the areas given to each crop has nothing to do with their harvested volumes. It only has to do with the graphic of the specific crop
- if the areas were appropriate, pie/donut graphs suck. Seriously, never use them. Use stacked column or bar graphs.
- the text has the actual info, but there is no logical ordering to the crops. Not ABC nor numerical. Ideally, you would list them in the order of highest harvest down to lowest.
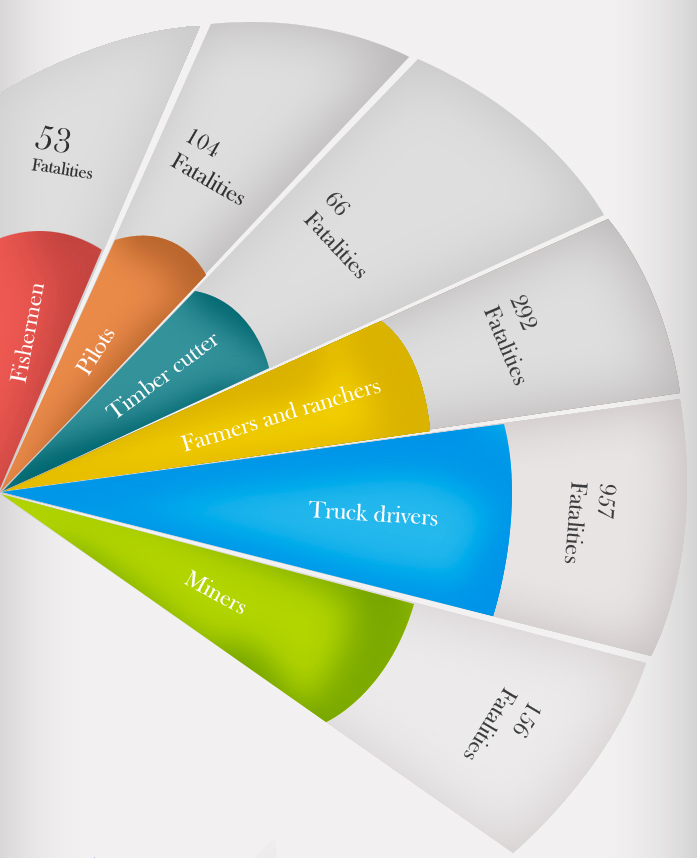
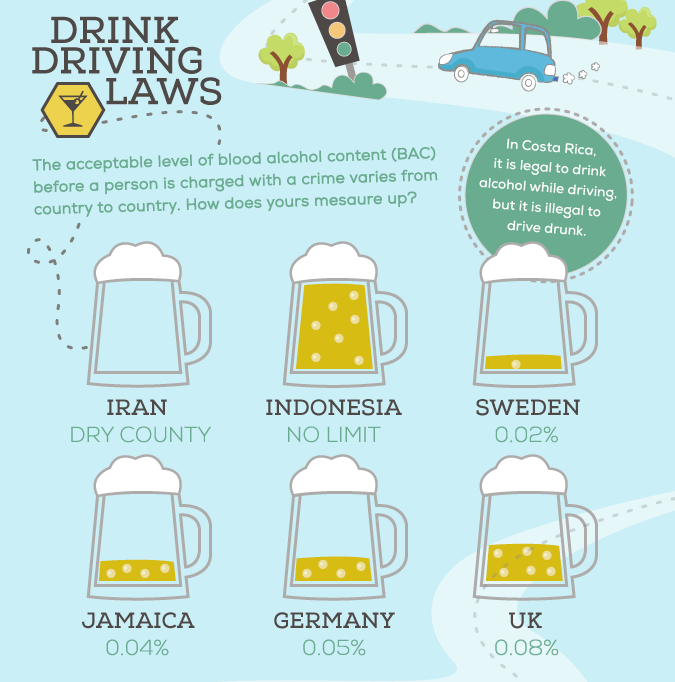
BAD VIZ ZOO
There are sites of bad data visualizations out there, of course.
Some of my “favorite” bad visualizations:

If visualizations aren’t your thing, how about culinary interpretations of your data?

Related Posts
Programming Note
Sunday Silliness: Soda Tax, Sierpinski Spreadsheet, and Swinish Puns
Memento Mori, or, Happy Birthday to Me
