Presidential Interlude: What are the Chances?
by meep
I’ve been mainly been ignoring the Presidential horse race of late, but a post caught my eye at Moe Lane:
This is an interesting factoid:
“… right now, the Republican presidential bench is much deeper, and younger, than the Democrats’: The average age of the five Democrats already running for president, along with Biden and Gore, is 66 years old. By contrast, the average age of the 17-person Republican presidential field is 57.4 years old.”
And it represents a real problem for Democrats. But for right now, they can’t do anything about it. Why? Easy: if they want to rebuild their brand, first they’d have to admit that there’s something wrong with their party. And that there’s something wrong with Barack Obama, who is the face of their party.
They will, of course, not do this. It’s easier to complain about redistricting and scary big money. Not necessarily smarter, but it’s certainly easier.
So the point that Moe (and Reid Wilson, the author of the piece quoted) is how out-of-touch and/or desperate the Democratic Party is, but come on.
Age! Old!
Makes a life actuary think of…. DEATH!

ACTUARY TIME!
Waaaaay back in 2008, people were remarking on howwwww old John McCain was.

So I decided to calculate some stuff:
Survival probabilities for 72-year-old man:
to age 77: 87.7%
to age 81: 74.5%
Note that McCain is still alive. We had a bit of fun discussing the probabilities at the Actuarial Outpost, bringing up the mortality of the respective candidates’ parents. (McCain’s mother was still alive then. HOLY CRAP SHE’S STILL ALIVE)
Let’s do some calculation! And some graphs!
WHO WANTS TO LIVE FOREVER?
Thanks to Michael Barone who gives us the birth years of all the candidates.
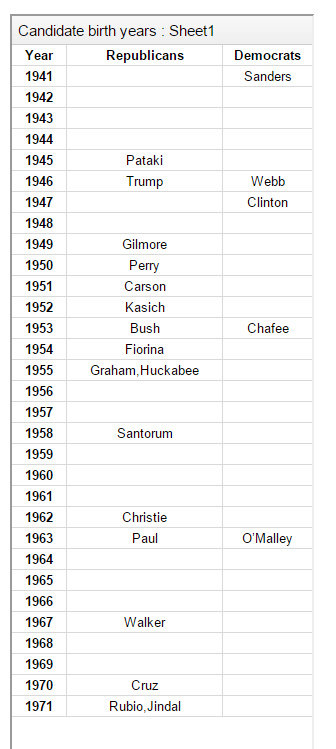
With that, I can make a graph of survival probabilities using the spreadsheet that can be found here (I made it, so email me if you have questions).
I will use two different mortality assumptions, just for the hell of it, but I’m being rough with the calculations — just assuming everybody had their birthday today, and just going by 8/18 on each of the future years… so I’m projecting out until 2025, when a two-term Presidency would end, if the person were elected to their first term in 2016.
GRAPHS OF SURVIVAL!
The spreadsheet with my numbers and sources are here and the resulting graphs:
Social Security results:

Well, that’s a bit of a mess. Let’s pare it down to only a few candidates:
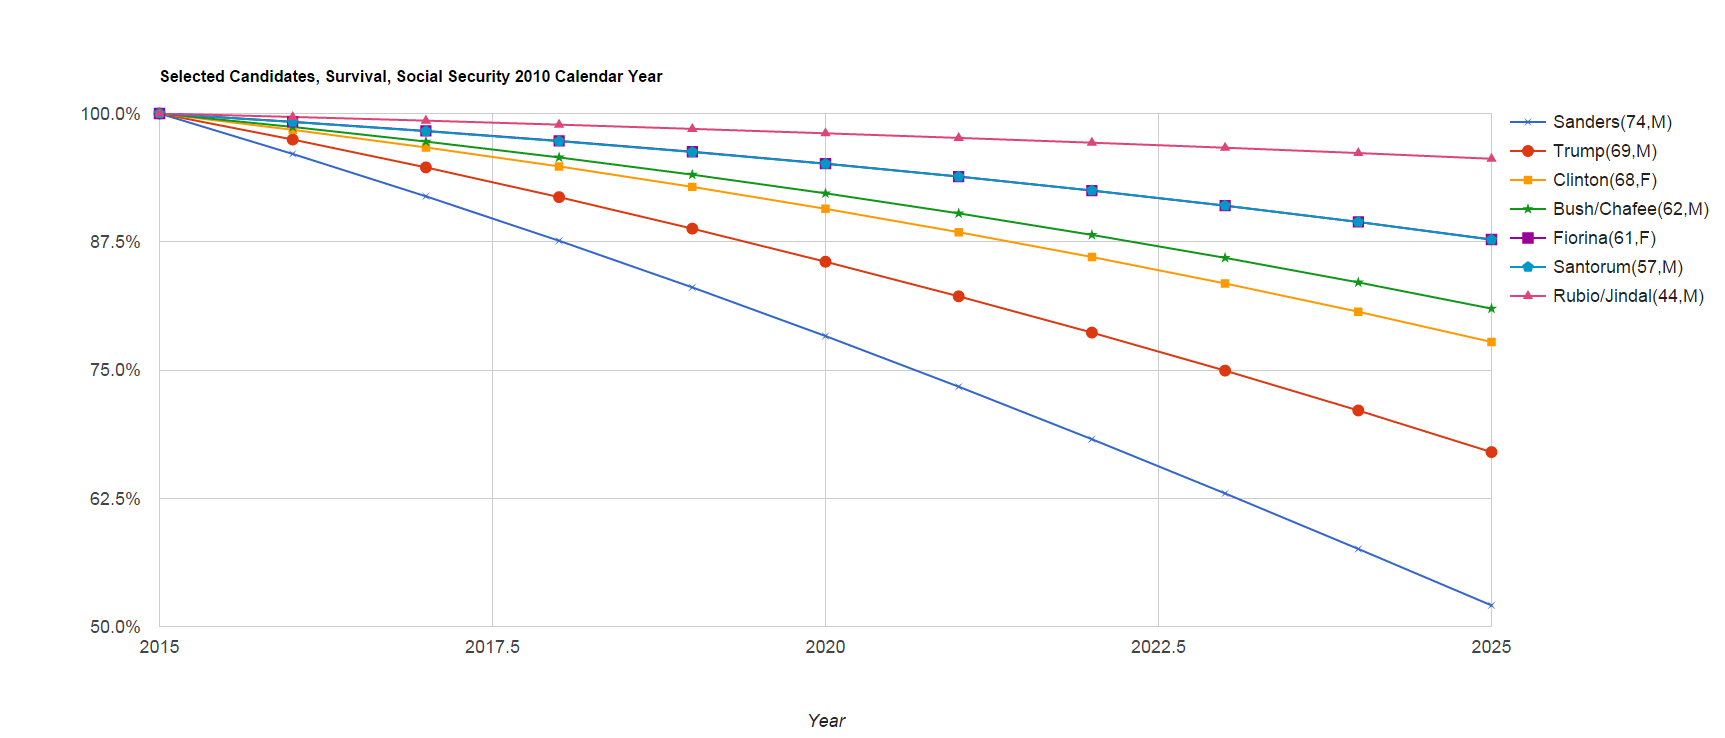
Features I want to point out:
- In the general population, 74-year-old men have a 50/50 chance (ish) or surviving past 10 more years.
- Clinton (68-year-old female) has survival curve only a little worse than man 6 years younger
- Fiorina (61-year-old female) almost exactly matches a man 4 years her junior
Biological sex definitely has meaning when it comes to mortality rates.
But those curves are based off the entire U.S. population. That includes the profoundly disabled, drug addicts, etc. I didn’t include any mortality improvement trends (and I’m not going to for the next set, either).
ANOTHER SET OF CURVES
The other extreme end is a mortality table based off of individual annuitants. Those who buy individual income annuities are generally longer-lived than the general population because:
1. They wouldn’t buy a life annuity if they knew their mortality would be worse than average (e.g., they’re a smoker and already have had one lung removed)
2. They’ve got the money worth settling on an income annuity (need to have within the $100Ks to make it worthwhile), and richer people do generally live longer
Anybody who becomes U.S. President will have access to the best doctors in the world, and won’t have to worry about cost. And they have to be healthy enough to be working.
I’m only going to do the reduced set for the graph:
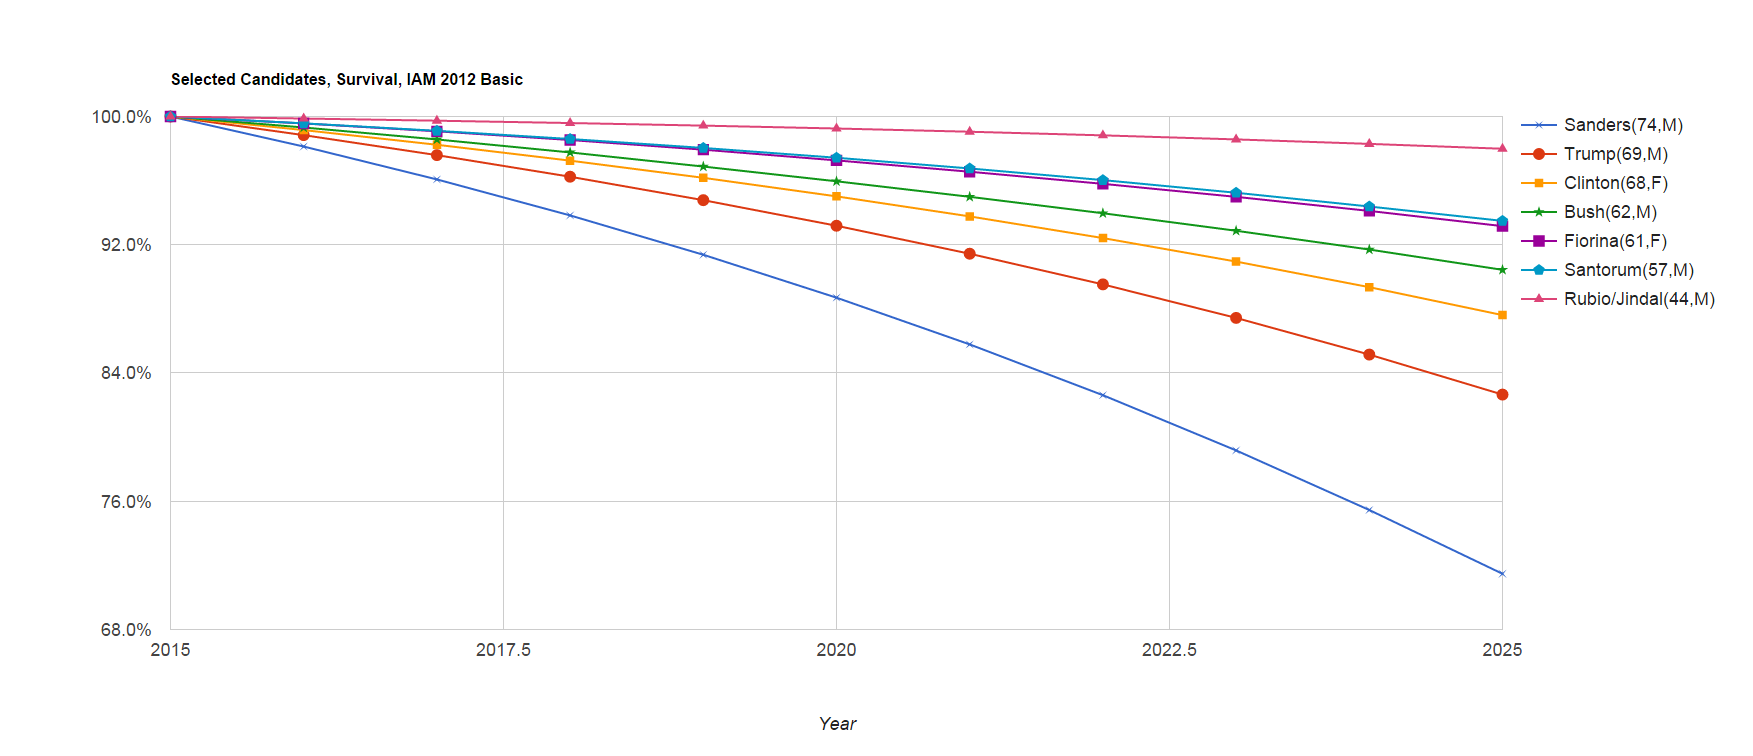
Features to note:
- Sander’s survival until 2025 improves 20 percentage points (mortality disparities really open up at old ages)
- Clinton(68) seems to pull a little farther away from Bush (62)
- Fiorina(61) does a little worse than Santorum (57), but they’re still very close
WHAT DOES THIS MEAN?
Not much, other than I’ve got some mental energy to let off.
But let me quote myself from 7 years ago:
So what does this mean in practicality? Not much, frankly. The central limit theorem doesn’t kick in at one person. I’m just trying to do a little education here. If we want to go with the stats of people dying in office, only a few had “natural” deaths (having read about FDR’s health stats… wooo… it’s amazing he lived that long. Top number for blood pressure around 300!) – assassins have held far more danger than old age. Remember it was John Hinckley who almost did in Reagan, not his old age — and even his Alzheimer’s disease didn’t claim him until a few years ago.
There are also morbidity tables to go for possibilities of various incapacitating conditions that would require McCain to resign, but it’s really not that useful to look at.
Considering the number of well-known people who suddenly died this year, many of whom were around twenty years younger than McCain, anybody can pop off at any time. Teddy Roosevelt was expected just to be a placeholder, and his VP pick was to stop him messing around with the NY political machine. Well, we see where that led. So I am not trying to diminish the risks here. I’m just trying to get the order of magnitude into the correct range.
I do find it very interesting that the press that bitched and moaned about how old McCain was is staying very mum about Sanders.
Because he is pretty old.
And I’ve got the mortality curves to prove it.
Related Posts
Top Causes of Death by Age Group, 2021: Finalized U.S. Stats
Presidential Mortality: Evaluating a Biden-Sanders Ticket
Deaths in the Dominican Republic: Westchester Woman Dies
