Kentucky Pension Liabilities: Trends in ERS, County, and Teachers Plans
by meep
In my prior Kentucky post, I looked at pension assets of the three large pension systems in Kentucky.
A reminder of the bottom line: the investment returns have been about average compared to other similar public pension plans, but the 10-year average is 2 full percentage points less than the assumed return on assets. As well, there has been some questionable asset-side governance for these plans. In particular, there is something wonky in the disparities between the state and county employees plans.
Let’s see what’s going on on the liability side. All the underlying data come from the Public Plans Database.
TOTAL LIABILITIES
As before, I’m going to be unfair and lump all the liabilities together.

Okay, that looks like fairly steady growth. Indeed, the overall CAGR (compound annual growth rate) is 6.2%.
Recall that the overall time-weighted return on assets was similar… BUT (graphing Liability & Assets on same graph):

Oh look. The liabilities are growing pretty steadily, but the assets are not. Indeed, the market value of the assets had a CAGR of 1.5%. That’s because yes, money is coming in in contributions and investment returns, but a lot of it is going out the door in benefits.
If I used the smoothed assets (aka actuarial assets), this graph wouldn’t look much better. The smoothed assets grew 0.3% CAGR over the period. Yeah.
PLAN-BY-PLAN: WHERE’S THE TROUBLE?
So, as before, let me break out the liabilities by plan.

We can see that the Teachers plan has the largest liabilities. I’ll just let you know the CAGR for each of the three:
Teachers: 5.5%
County: 8.0%
State Employees: 6.2%
I want to point out the “good” pension — County — has a relatively high liability growth rate compared to the two other pensions.
Of course, what makes County “good” is that they’re paying the full ARC.
Let’s look at the percentage of “required payments” each of these plans has made:

100% sits smack dab in the middle. Note: CERS is always above that line. The State plan have been way below that line for a decade. The Teachers plan… has been doing wonky stuff.
FUNDEDNESS RATIOS
So let’s check out the fundedness ratios, shall we? This uses the smoothed assets and the GASB liabilities.

That’s just awful. So yes, that underfunding of the State ERS really has taken a toll (22% funded ratio for 2015), underfunding for Teachers was slowed with that 2011 cash infusion (I’m assuming it was a pension obligation bond, given the amount of money involved), and the County ERS…. wait.
County ERS has been making more than 100% ARC contributions. And yet, the fundedness has leveled off at about 60%, not much better than the Teachers plan.
What has been going on?
BEHIND DECREASING FUNDEDNESS RATIOS
So a few things can be contributing to this decreasing funded ratio for the county plan.
First, the underperformance of the assets. As noted in the prior post on Kentucky pension assets, the returns have been about 6% for 10 years, and the valuation assumption for County ERS was 8.25% in 2001 and has been brought down over time to 7.5% in 2015. That 7.5% may still be too high, considering. That’s one.
Here’s two: there is a payroll increase assumption. I’ve talked about this before. Reminder: assuming a growing payroll, and contributions are to be made assuming a level percentage of the payroll contribution will suffice, means that you’re backloading contributions some.
If the payroll doesn’t grow as fast as the assumed growth rate, you end up with actuarial losses. The Public Plan Database gave me the payroll growth assumption for only a few years: 4.5% in 2013, and 4% in 2014/2015.
Let’s see what the historical payroll growth rate has been: 2.7% from 2001 to 2015.
That’s a bit different.
Here’s a few other possibilities: different retirement patterns than expected, retirees living longer than expected, etc.
Checking the 2015 CAFR, I see that they changed the mortality assumption to something fairly standard — RP-2000 brought forward using scale BB (though it looks like they’re using only some improvement; that said, they said they were using an experience study).
So I looked at the 2014 CAFR to see what the mortality assumption had been before.
The rates of mortality for the period after service retirement are according to the 1983 Group Annuity Mortality Table for all retired members and beneficiaries as of June 30, 2006 and the 1994 Group Annuity Mortality Table for all other members. The Group Annuity Mortality Table set forward 5 years is used for the period after disability retirement.

Uh.
Okay, let me not over-react here. I have not done a thorough calculation, but the life expectancy difference in the base tables would be only about 1 year at birth (okay, 1 year more of payments than expected makes an impact). But that’s not including the mortality improvement scale.
And, more to the point, the higher the discount rate you use, the less that difference matters.
ASSUMING EVERYTHING IS CHEAP DOESN’T MAKE IT SO
But let’s ignore the exact calculations and think things through: when the assumptions are all off in the same direction – that is, they all say you have to pay less now than what actual experience has turned out to be – then yes, you can be making full required contributions every year and your funding status deteriorates.
It doesn’t require one year of awful investment returns to obliterate your funding status – if that were the case, most plans would be close to 100% again. We’ve had many years of very good results. The 5-year averages are about 9 – 10% annual returns (time-weighted)
It takes everything being off by just enough, all in the same direction, that the “experience losses” just compound. Your investment returns too low, your payroll growth too low, your retirees living too long, etc.
While mortality assumption was updated — who knows… that’s one of those “takes a long time to figure out if you’re wrong” sort of things. The return assumption may still be too high. Same for the payroll growth assumption.
And that’s why this happens:
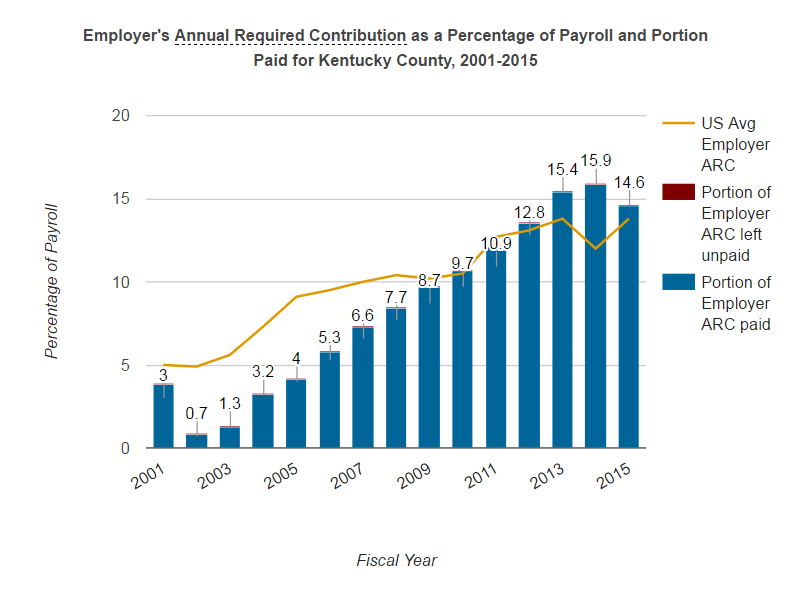
The required contribution will keep climbing as each year you have losses.
And I didn’t even mention the amortization issue.
They’re amortizing their actuarial losses over 28 to 30 years. One should be amortizing over the expected (weighted) years to retirement for active/vested members.
So, bottom line, yes, County ERS, you are somewhat better-behaved than the State plan in that you are making the contributions you are being told you should. But you’re about the same as the Teachers plan, which had been using a lower assumption for investment returns all this time (also, their payroll growth is a bit closer to 4%, at 3.2%…. the State plan actually has had a contraction in payroll over the period. I did not dig into their mortality assumptions.)
But if the County plan had been using a little more conservative assumption sets to begin with, their contribution levels would not be growing as rapidly as they are. That is, they should have been making even higher contributions all along.
Having a 60% funded ratio is not something to be proud of.
Related Posts
Around the Pension-o-Sphere: Actuaries Testifying, New Standards, Actuary Bloggers, Pew Report, and Connecticut
Kentucky County Pensions: 60 Percent Fundedness and Decreasing is Awful
Kentucky Meltdown: Teachers in Revolt, Bill in the Sewers, and Nothing Actually Solved
