Kentucky County Pensions: 60 Percent Fundedness and Decreasing is Awful
by meep
Before I begin: Yes, I saw this report about how fully-funding public pensions may be a bad idea.
Yes, I plan on blogging about it. But I need to get a little less angry before I blog.
Never blog angry.

KENTUCKY COUNTY: YOU SUCK, TOO
I didn’t think I needed to point this out, but just because your poorly-funded pension is not as poorly funded as another pension doesn’t mean it’s in great shape.
For example, that I know of people who are in much worse health than me does not fix the fact that I’m in poor health myself.
There’s a facebook group that had linked to my Kentucky pension post and I saw the following stuff:
Don’t let anybody tell you otherwise: it’s the underfunding:
“But the main thing I note — the purely investment performance of the funds don’t seem any different than most other public pension funds. There may be iffy things going on in the asset management, but it seems to me there’s a really simple explanation for why Kentucky ERS is in an asset death spiral:
The state has been deliberately grossly underfunding it for years.”
Yes, the state plan has been grossly underfunded on purpose.
The county plan has also been underfunded, but I would say that’s less on purpose. It means CERS is less worse off, but it’s still in poor shape.
(and no, I’m not comparing against 80% — I’m comparing against 100% and that this fundedness ratio has had a bad trend.)
This is the comment I made at the facebook post:
Hey y’all — I’m meep, the author of that blog post (and almost all the posts at STUMP). It took me a while to find this post on facebook.
Yes, the underfunding is a huge problem, but you need to understand that CERS, even though it has been making 100% of recommended contributions, is =also= underpaying.
CERS isn’t underpaying on purpose, but it has to do with how the pension liabilities are valued and the assumptions made for future payments. It’s biased towards putting too little in now, assuming that the shortfalls will be made up for later.
If you’re making full payments and the funded ratio keeps going down (and those required payments keep escalating), that tells you that the “full” payments weren’t as full as you thought.
While CERS is better off than KERS, it’s in a bad shape.
I will do another post on this to highlight that issue.
Got a response:
Happy to have your feedback, Mary Pat. I appreciate that the other funds are by no means adequately funded. We’re doing triage here. We’re identifying the KERS non-hazardous and State Police funds for special concern. K-non is threatened with insolvency. In the long term, our bet is that the cash-balance plan will address the CERS issues, or at least is a good start.
I don’t know about the specific proposal for CERS, but I do want to just focus on CERS, as KERS is in such a bad position, it’s not helpful to look at it in dealing with CERS’s issues.
BAD RESULTS COMPARED TO OTHER “FULLY FUNDING” PLANS
Remember in one of my recent posts re: South Carolina pensions, I filtered on all the plans that were making “full” contributions from 2001 to 2015, and came up with this graph:

Note that point aaaaall the way to the right. Kentucky County. Was 140% funded in 2001, down to 60% funded in 2015.
After 15 years of making supposedly full payments.

Only three other plans in the “fully funding policy” group have lower funded ratios in 2015, and they all started out at much lower ratios to begin with.
Now, of course, there are plenty of other plans that are in worse situations (like Kentucky ERS) — these were filtered out because they were deliberately underfunding the plans.
So let’s see what happens when I throw in the underfunding plans.
STILL BAD WHEN LOOKING AT ALL PENSIONS
Here’s your graph.
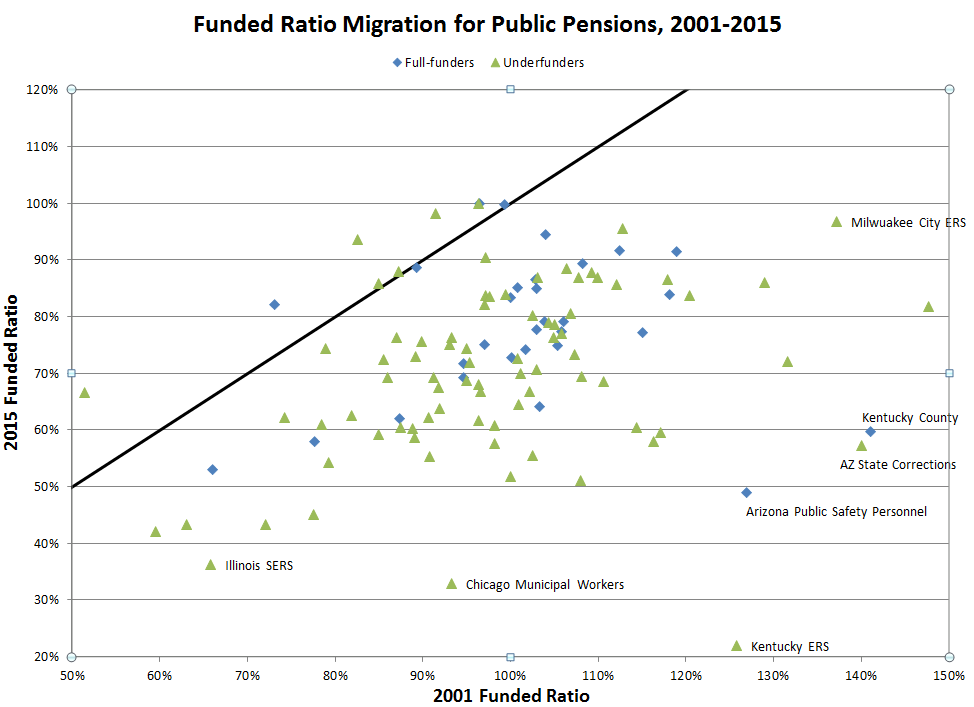
Remember that the black line divides the plans whose funding ratios improved between 2001 and 2015 (those are above the line), and the ones that disimproved (as we say in the biz).
So now, we’ve got a lot more plans that are worse off than Kentucky County pensions.

Oh right, that Kentucky ERS is in a hideous place does not really help the county plans at all.
Mind you, it’s really difficult to do a fair comparison between plans. I’m simply using the funded ratios that come out of the Public Plans Database, and they’re getting these numbers from the official CAFRs. Different plans use different assumption sets, and it’s difficult to make head on comparisons.
But. Even if I really can’t do a huge amount of head-to-head comparisons due to these differences, there still is the directional aspect of the changes.
HISTOGRAMS OF FUNDED RATIOS
Just for fun, I’m doing histograms of funded ratios for all the plans I have in my sample, whether they contribute 100% ARC or less, or even if I’m missing data for particular years. I’m picking a few key years for looking at funded ratios. I’m not weighting it by assets or liability amounts (though I should… I’ll do that another time. It’s much easier to just count number of plans.)
And so we can compare, I’m graphing them against each other.
For the simplest graph, I’ll look at 2001 and 2014 (not enough plans with data for 2015):

Features to note:
- Peak funded ratio is in 100%-105% range in 2001
- The histogram in 2001 looks rather continuous, as if it were a nice distribution
- Peak funded ratio is in 80% – 85% range in 2014
- There are large drops for the bins right next to it, though… perhaps some adjusting aspects to get above the all-holy 80% mark?
- Very few plans are >100% funded in 2014… even though the stock market had a pretty good run for a few years at that point… similarly to the market up to 2000.
I wouldn’t set too much store by the continuity – there can be a plan size effect going on, etc. And I didn’t weight by plan size, which may give different results.
But oof.
I got too depressed looking at how many plans were >100% funded, so I looked at how many plans were >95% funded in key years.
2001: 63% of plans by count
2007: 24%
2008: 18%
2014: 6%
Ugh. That’s not good.
Oh, and by the way, Kentucky County? Looking at your percentile ranking in funded ratio among all the pension plans…
2001: 97th percentile (yay!)
2007: 36th
2008: 34th
2014: 26th
2015: 19th percentile
So celebrate. You’re better than 19% of the public plans in the Public Plans Database for which we have 2015 data already, including better than Kentucky ERS.
You’re not dead last.

How did you get that way? Well, for one, those “full” payments you were making weren’t as full as you thought. The high fundedness early on may also have been an illusion, due to valuation assumptions. Lowballing the ARC & undervaluing the accrued liability tend to go hand-in-hand.
But I can address that another time.
Related Posts
Kentucky Pension Update: GIVE US A BUNCH OF MONEY
Kentucky Pension Liabilities: Trends in ERS, County, and Teachers Plans
South Carolina Pensions: Investment Returns Recalc
