Are Public Pensions in a Crisis? Part 2: Is Pay-as-You-Go Sustainable?
by meep
I have had my say.
Let’s see what others say.
First up, research published by the Brookings Institute.
DO NOT PANIC. PAY-AS-YOU-GO IS JUST FINE
This is one of the many pieces I’m responding to:
What Crisis? The Case for Not Panicking Over Pension Debt.
New research released this week shows that even pension plans with big unfunded liabilities are likely to survive in the long term.
Over the past decade, public retirement costs have spiked while governments’ unfunded liabilities —now totaling more than $1.2 trillion — have continued to grow.
But according to research that debuted this week, lawmakers shouldn’t worry too much about accumulating pension debt. “There’s an assumption that fully funding pensions is the right thing to do,” said the Brookings Institution’s Louise Sheiner at the paper’s presentation. “Most of the work in this area has been about calculating how unfunded these plans are [and] that’s led to a lot of concern that these plans are in a huge crisis.”
Sheiner, along with co-authors Byron F. Lutz of the Federal Reserve Board and Jamie Lenney of the Bank of England, say that’s not the case. They argue that pension debt is stable as long as its size relative to the economy doesn’t increase. “When you approach the pension situation from a public finance [and sustainability] angle,” Sheiner said, “there’s less of a crisis than is typically portrayed.”
Seriously?
That’s the argument? That it doesn’t matter if the assets run out, as expected, because pay-as-you-go will be just fine… as long as what made the assets run out stops happening (i.e., pension benefits growing too fast).
There’s actually some nuance to the above. Let’s look at the actual research paper.
ACTUAL RESEARCH PAPER: SHOWS PLANS RUNNING OUT OF MONEY
The Sustainability of State and Local Government Pensions: A Public Finance Approach
In this paper, we explore the fiscal sustainability of U.S. state and local government pensions plans. In contrast to much of the recent work on state and local pensions, which has proceeded from the vantage point of financial economics and focused on valuing pension liabilities, we adopt a methodological perspective relatively more rooted in the public finance tradition and assess the sustainability of these pensions on a pay-as-you-go basis and from the standpoint of public debt sustainability. In particular, we examine if under current benefit and funding policies state and local pension plans will ever become insolvent, and, if so, when. We also examine the fiscal costs of stabilizing pensions under a number of different metrics of stability, and examine the costs associated with delaying such stabilization into the future. We explore these questions by reverse engineering the future benefit cash flows of the pension plans using information contained in annual pension actuarial reports and government financial statements and by making long-run macroeconomic and demographic projections. Our results suggest that, under low or moderate asset return assumptions and in aggregate for the U.S. as a whole, pension debt can be stabilized as a share of the economy with relatively moderate fiscal adjustments. Notably, there appear to be only modest returns to starting this stabilization process now versus a decade in the future. Of course, there is significant heterogeneity with some plans requiring large increases to stabilize their pension debt.
So they’re looking at sustainability of pay-as-you-go systems (or perpetually underfunded plans), because they can’t deny that many public pension funds are going to run out of cash.
And that last sentence: they also can’t deny that some plans are in a really bad position.
Running out of cash is what they define as “insolvent”, versus what insolvency would be for insurance companies – which get taken over by regulators if they don’t have enough assets (plus some extra for adverse situations) to cover all the promises they’ve made.
From one of the exhibits in the report:

A few notes — they choose 40 plans out of the Public Pensions Database (that had 177 plans) and do projections similar to my cash flow projections (but fancier. I’d be curious to compare their results to mine). They have no Chicago plans in there, by the way, but they picked that sample of 40 plans to have somewhat similar stats as the full set:

So they do have a few that will definitely run out of cash, and then some that seem sustainable, given certain assumptions.
They look at various definitions of stable systems, such as “implicit pension debt to GDP ratio is stable”. And I agree, if that’s how you define stable, it doesn’t much matter if you start now or in ten years.
I don’t consider that stable, though.
The problem is that the very reason the public pension funds are running out of cash will make it impossible to support the pensions on a pay-as-you-go basis.
PAY-AS-YOU-GO IS FUNDAMENTALLY UNSTABLE
Heck, public pensions used to all be pay-as-they-went, and given the trouble various public pensions ran into in the 1930s, they realized they needed to pre-fund the pensions.
When I pore through the Public Pensions Data… well, look at when funds were established, by count:

The spike in the 1940s comes from hard-fought experience, I’d say, and many predate the end of WWII. Of the 53 plans started in the 1940s, 21 started from 1940-1944. Even note the growth in the 1930s compared to prior. Many localities learned from the experience of the Great Depression that they needed to set up funds ahead of time, if they were truly going to promise benefits.
There are two aspects: the tax base has to keep growing or the pension benefits have got to quit growing so rapidly for pay-as-you-go to be stable.
What if you’re Detroit? Or Illinois? Or Chicago?
SHRINKING TAX BASE DOOMS PAY-AS-YOU-GO
What if the taxpayers keep moving away because the TAXES ARE TOO DAMN HIGH?
Illinois is an extreme outlier nationally when it comes to losing people to other states through domestic out-migration. Unsurprisingly, it’s also an outlier when it comes to losing the incomes those people take with them.
According to IRS data, the 250,000 residents who moved from Illinois in 2016 took $11 billion in adjusted gross incomes (AGI) with them to other states. In contrast, the 165,000 who moved into Illinois that year only brought with them $6.3 billion.
That left Illinois with a net loss of $4.8 billion in AGI and cost the state more than $100 million in lost tax income tax revenue.
….
Long-term loserIllinois’ losses in AGI have been going on long before 2016. In fact, Illinois has been one of the worst overall losers of AGI since 2007, the first year the IRS published summarized state AGI data.
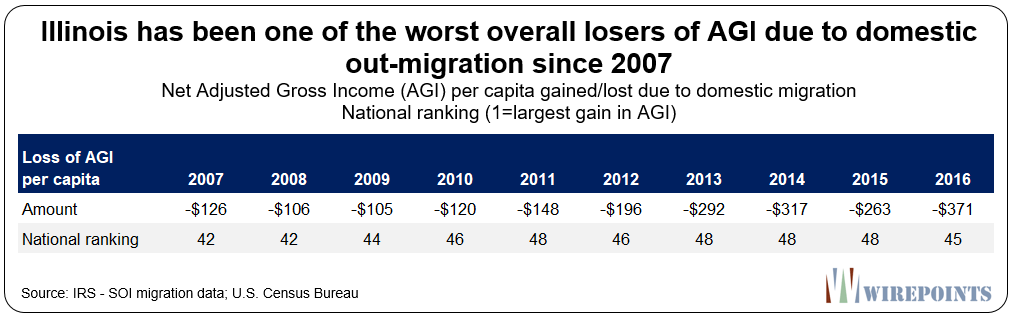

I note that these are per capita measures, as opposed to being absolute dollar measures. (Also, my tax-my-hide states of NY and CT are even worse than Illinois, which surprises me not one bit. Connecticut is in a horrid situation.)
If we looked at the actual $$ lost, it’s one of the worst. It would be #2, right after #1 New York (we’re number one. Woo.)
But here is the point: both the underfunded public pensions and a sustainable pay-as-you-go system assumes that the tax base grows at least as fast as the pension benefits.
That the tax base is not growing rapidly enough to cover “required” pension contributions is a fairly good indicator that the tax base is not growing fast enough to sustain pay-as-you pensions without adjusting the pension plans somehow.
BACK TO RESEARCH PAPER: YES, PENSION EXPENDITURES HAVE BEEN GROWING
There are actually a lot of good figures and tables in the paper, and we will see some below. I obviously don’t agree with their definition of what constitutes a stable public pension system. But I don’t dispute their math, for their given assumption set. And they’ve also got some useful metrics to see what’s been going on.
Here is figure 2, which took me a little while to decipher, because the vertical scale wasn’t labeled. It represents the percentage point change in the share of state expenditures, as measured as percentage of tax receipts (hmmm, not including bonded revenue?)

Pension contributions rose from 5.3% of tax receipts to 8.7% from 1998 to 2017. That is represented on the graph as a 3.4 percentage point increase. Pretending that tax receipts remain level (they didn’t, but we’ll ignore that), that’s a 64% increase.
Compare to the decrease in age share of wage and salaries — from 61.2 to 54.9%. That is shown as a 6.3 percentage point drop. That’s actually a decrease of 10%.
Of course, tax revenues did not stay still over this period. I grabbed some stats from the Tax Foundation. Now, that’s just from 2004 to 2015 — but there was a 55% increase over that period for own-source revenue for states (not including federal transfers). I could have turned that into a per-year rate and yadda yadda, but if we take that 55% growth in tax revenue, and combine it with a 64% increase in percentage of tax receipts, that’s an increase of about 150%.
If we assume a 150% increase over 19 year period, that translates into a growth rate of 5% per year. That doesn’t sound so bad, when I put it that way, right?
Of course, those tax revenues increased from 2004 to 2015 at an annual rate of 4%.
Over time, that disparity in growth rates causes trouble.
THE EFFECT OF AGING STATES
Now, I do agree that some of these pension plans will be sustainable-ish for many years and not be fully-funded.
I also agree that nobody needs to panic. Panic is never a good reaction to anything, really. It’s not helpful. If you see a black bear running towards you to maul your face, panic is not going to make it better.
But when you have aging and shrinking populations, exactly how is any of this sustainable?
Across Maine, families like the Flahertys are being hammered by two slow-moving demographic forces — the growth of the retirement population and a simultaneous decline in young workers — that have been exacerbated by a national worker shortage pushing up the cost of labor. The unemployment rate in Maine is 3.2 percent, below the national average of 3.7 percent.
The disconnect between Maine’s aging population and its need for young workers to care for that population is expected to be mirrored in states throughout the country over the coming decade, demographic experts say. And that’s especially true in states with populations with fewer immigrants, who are disproportionately represented in many occupations serving the elderly, statistics show.
“We have added an entire generation since we first put the safety net in place but with no plan whatsoever for how to support them,” said Ai-jen Poo, co-director of Caring Across Generations, which advocates for long-term care. “As the oldest state, Maine is the tip of the spear — but it foreshadows what is to come for the entire country.”
I went through the paper, seeing what they had to say about places like Rhode Island (nothing, though one of the plans is in their sample), and places where the tax base is shrinking.
I found a few items:
[page 6] In terms of fiscal sustainability, a fully unfunded paygo pension systems can be fiscally sustainable—i.e. require no outside funding. In particular, an unfunded paygo system can honor obligations without recourse to outside funding as long as the internal rate of return paid to retirees does not exceed the growth rate of the wage base, equal to population growth plus productivity growth (Samuleson 1958). Thus, these programs are only unsustainable if their costs rise at a faster pace than the underlying stream of revenue with which they are funded; such an event is typically caused by (1) demographic changes that increase the growth in outlays and/or lower the growth of revenues and (2) benefits rising faster than the underlying source of revenue because of increasing benefits promised over time. In the absence of such shocks, mature, hybrid systems—such as state and local pension plans—can remain sustainable even in the face of adverse shocks, as accumulated assets provide a buffer.
I both agree and disagree with this paragraph. First, why should we expect that the big IF (IRR paid to retirees does not exceed growth of potential tax base) to hold? Second, why call a decrease in population a “shock”? In some cases, such as Katrina hitting New Orleans, one does have a shock that greatly reduces local population.
However, most of the demographic disasters I’m seeing, such as the aging and shrinking of specific states & cities, are very long-term, make paygo unsustainable, and are not a “shock” unless you think something that unfolds over 30 years is a “shock”.
I do agree that if the big IF is upheld, then sure, it’s sustainable. I can’t argue with that. Social Security has been paygo since its start, and that was “sustainable” as long as the working population had been growing in relation to retirees. It did with the Boomers. With the demographic cratering since then (howdy from a Gen Xer, aka a Baby Buster), it’s not quite so sustainable.
Next:
[page 8] For instance, a locality such as a city can experience sharp population loss, which would drive down the local tax base (i.e. reduce the growth rate g). Existing pension debt could well rise significantly as a share of the tax base and become unstainable. Overall, it would be very useful to have a stronger sense of which plans are sustainable and which plans are not, as well as a better sense of the magnitude of the fiscal stress likely to arise from placing plans on a sustainable trajectory. This paper aims to provide such information.
Excellent — let’s see which are the unsustainable plans.
WHICH ARE THE UNSUSTAINABLE PLANS?
I searched on the term “unsustainable” to see if the qualities of unsustainable plans were detailed.
Other than the preliminary items, I found this definition:
There are various ways to think about pension debt stabilization. Pension debt is stable when it holds at a fixed share of GDP: pension debt is unsustainable if it continuously rises as a share of GDP. Another aspect of pension debt stability is asset exhaustion, which may impose constraints if plans are unable to borrow or only borrow at relatively high rates of interest.
Okay, we have our definition. So which plans will these be?
[page 21] Figure 10 shows what happens to the unfunded liability relative to GDP for the US plan as a whole if asset returns are 3.5%. The black dotted line shows that without changes in contribution rates, implicit debt to GDP rises at an increasing pace over time. The current situation is unsustainable. The other four lines show the trajectory of the debt-to-GDP ratio if the government acts now or later. Even if the government waits 30 years to act, the implicit debt to GDP ratio isn’t much higher than it would be if the government acted today. Table 3 presents these estimates for all three asset return scenarios. Table 4 presents the estimates on a plan-by-plan basis.
Here’s figure 10:

This is using specific sets of assumptions, showing that at various points – now, 10, 20, and 30 years in the future, this particular ratio could be stabilized. Assuming all sorts of things, of course.
Here’s Table 3:

So let’s understand what we’re seeing with table 3 — they’re showing what percentage point increase (as percentage of payroll) would be required to do this stabilization of implicit pension debt-to-GDP ratio. Let’s just look at the 3.5% real rate of return row. It doesn’t make a huge difference if we act now or 30 years in the future, right?
Of course, this is “stabilizing” the debt-to-GDP ratio at whatever level it is then. Which means that if you wait 30 years, you’re going to be in a more levered situation, and borrowing ability will be more constrained. It sure as hell does make a difference if you wait 30 years vs. acting now. The debt level you’ve “stabilized” to will be different.
Finally, table 4 — I will excerpt only a little:

Let me interpret the top row first. The current contribution rate for the overall sample is about 24% of payroll, and if you have a 3.5% real rate of return, and you want to stabilize the debt-to-GDP ratio right now, you’d need to increase that to 28% of payroll. That’s only a 17% increase (if payroll remains level).
But let us go down to the individual plans. Let me pick on Texas to begin with: Texas Teachers currently has a funded ratio of about 80% and has had some fairly low contribution rates, and the table here says 15% of payroll (I guess that’s employee + employer contributions). If they want to stabilize that debt-to-GDP ratio with a 3.5% real rate of return in 10 years, they’ll have to increase contributions by about 100%.
That doesn’t sound sustainable to me, mainly because: how likely do you think Texas would pass that?
Let’s go up to California Teachers, which has a notoriously bad contribution history and which has been bobbing along about 65% funded. This table shows a 32% current contribution (again, I assume this combines EE and ER), and if there’s a 3.5% real rate of return, if they wait 30 years to fix, they’d need to increase that to a 58% of payroll contribution to stabilize it at whatever awful funding status it would have then.
Is that at all likely?
THEIR CONCLUSIONS AND MY CONCLUSIONS
Let me quote their conclusions to the paper:
VI. Conclusion
We find that pension benefit payments in the US, as a share of the economy, are currently at their peak level and will remain there for the next two decades. Thereafter, the reforms instituted by many plans will gradually cause benefit cash flows to decline significantly. This is an important finding in terms of the fiscal stability of these plans over the longer term as it indicates that the cash flow pressure of these plans will eventually recede. Our results suggest that, under moderate asset return assumptions and in aggregate for the U.S. as a whole, pension debt can be stabilized with relatively moderate fiscal adjustments. Of course, stabilization costs are higher if asset returns are lower. There is also significant heterogeneity with some plans being far from stable across a range of asset return assumptions. Finally, there appears to be little advantage to beginning the stabilization process now versus a decade in the future; neither the level at which debt stabilizes as a share of the economy nor the contribution increase needed to achieve stabilization increase much when the start of the stabilization process is pushed a bit further into the future.
That’s the entire conclusions section. It is true that some places have made reforms so that new benefits are a lot less rich than prior benefits. That should make the systems more sustainable going forward.
I do not fault their projections or their assumptions, per se, that go into these projections.
I do object to underemphasizing the level at which the debt-to-GDP ratio “stabilizes” being unimportant. It’s pretty damn important. It has effects. That said, I was showing only the first target of “stabilizing” — two other methods were to make sure the debt-to-GDP ratio gets to be where it is currently in 30 years time, and one was to stabilize it at the current ratio.
But mostly, I object to not really pointing out the unlikelihood of necessary changes to “stabilize” these situations. Some of the changes for contributions are very large compared to what is contributed now. So what happens then?
[page 20] The message from these exercises is that, for most plans, there is no imminent “crisis” in pension plans, in the sense that the plans are likely to exhaust their assets within the next two decades. But, many plans are not stable and a sizeable share of plans will exhaust their assets within 30 years under the 1.5% return scenario. Adjustments will be necessary. The questions are: how large is that adjustment, and how urgent is it?
Thus, the three different targets in working all this out. They do show trajectories.
I think it is important to do something like this as a baseline. It’s a good start to find various stable points… under certain stable assumptions. They have constant asset returns and predictable growth in GDP, etc.
All of these assume there are no “shocks” of any kind to the system… and given how pension funds are invested, that is extremely unrealistic.
STRESS SCENARIO: REQUIRED FOR REAL-WORLD MANAGEMENT
So, given that public pensions don’t live in a world of pretty models, but have to deal with real-world results on both asset and liability sides, let’s have pension plans work through a scenario: just run it through some historical return scenarios. We know these are realistic, as they actually happened.
Check out this historical record of annual returns, which includes the S&P 500. It goes back to 1928. We don’t need to propose a scenario of running through 2008 again. How about a recap of 2000-2002 (-9%, -12%, -22%) — yes, three years of consecutive negative returns, getting worse each year. You have money going out the door in terms of benefits, you’re squeezed to increase contribution rates, and may even need to reduce payroll some.
What then?
These are real scenarios many pensions went through, and in the case of plans like Calpers, they had just boosted pension benefits on the false statement that the retroactive boost would cost essentially nothing, as the plan was over-funded as it was.
Then three years of negative market returns. That would explain why all those very-well-funded plans dropped in funding ratios in those years. Also, many plans had taken advantage of that overfunded level in fiscal year 2001 to drop contributions for subsequent fiscal years.
Now, this is a matter of timing – many plans don’t use calendar year as their fiscal year, but run July 1 – June 30. But it doesn’t really matter – just sample from real history, and see how sustainable the pension plans are. The timing of these returns is important, as I wrote about in this post on time-weighted vs. dollar-weighted returns.
At the end of that linked post, I did a graph where I had measured pension fund volatility:

Some of those funds are quite volatile, on the asset side. How volatile are they on the liability side?
In any case, here is my point in all the above: these theories are all very pretty (and I originally entered the public pension debate in arguing over theory, way back when it was a matter of fighting with pension actuaries over liability valuation).
But these pretty theories are not necessarily stable, and may depend on several things behaving in non-volatile ways.
While this paper is a good place to start from, I would recommend the researchers to hit these plans with a few years of bad markets and then see what happens. Just a few historical stress scenarios should do the trick —could just be the assets, but GDP would likely be hit as well (State GDP data goes back to 1963 here.).
That could help test exactly how stable these systems are.
PUBLIC PENSIONS IN CRISIS SERIES
- Part 1: My opinion
- Part 2: Is pay-as-you-go sustainable?
- Part 3: Is it just an accounting problem?
- Part 4: On closing DB plans and replacing with DC plans
- Part 5: On Bonds and Bailouts
Related Posts
Calpers Myths vs. Facts: Page is Gone But The Internet is Forever
The California Rule Court Case: What Can Be Changed on Public Pensions?
Taxing Tuesday: A Promise to Raise Taxes, Who is Paying Most Taxes, And Who Gets the Cuts?
