Illinois Pensions: Teachers Retirement System (TRS) number-crunching
by meep
And here we are at the big one: Illinois Teachers Retirement System.
As you’ll soon find out, the reason Illinois TRS is a problem is not the size of the individual pensions themselves, but the number of individuals involved.
But let us not get ahead of ourselves.
FINANCIAL STATEMENTS
As with the others, let’s look at the most recent financial statements.
Unlike SURS, which made me dig for info, there is a nice summary on the first page with content:
Active contributing members 159,838
Inactive noncontributing members 122,964
Benefit recipients* 112,333Total membership 395,135
Investment return
Total fund investment return, net of fees 17.4%Income
Member contributions $928,745,853
Employer contributions 158,334,598
State of Illinois contributions 3,438,382,892
Total investment income 6,782,031,720
Total income $11,307,495,063Expenses
Benefits paid $5,225,206,828
Refunds paid 95,456,151
Administrative expenses 21,218,069
Total expenses $5,341,881,048
As with the others, I’m going to do a little arithmetic to see how well things are going.
Contributions from all sources total: $4.5 billion
Benefits paid: $5.2 billion
Again, the investment income provides a nice cushion, but 2013-2014 had great returns – do you get 17% on your investments every year?
More to the point, do you see how this might be a problem on a pay-as-you-go basis? The contributions would not be able to cover the benefits.
This is why pensions are pre-funded. Forget about “intergenerational equity” and the like — population sizes fluctuate, you can have huge growth in an employee population such that what was once a small pension benefit burden when 90% of plan participants are active employees becomes a monster when all those people have retired. If the retiree population is too large, no matter how modest the benefit promised to each individual, pay-as-you-go cannot be sustained.
This is not a problem unique to Illinois.
This issue will keep coming up, by the way. But let us keep our eyes on Illinois alone for now.
For a quick look, here is the retiree-to-active ratio for TRS:

This is still well under 100% and close to the national average. At least the Teachers pension is not upside-down.
Yet.
BENEFITS PAID
Pension 360 has a nice visualization of the most recent full year of retiree benefits:

This heat map has a peak near $80K for about 35 years of service. I think to many people, that does not necessarily sound outrageous in terms of size of pensions for the number of years of service, especially given many/most of them can’t collect any Social Security. But it is a bit higher than many retirees’ income.
Let’s file that thought away for now. I am not trying to stoke pension envy, but I want you to realize that a lot of modest pensions can make for very large trouble.
Thanks to Ted Ballantine of Pension 360 for sharing the data behind the graphs, so I can make my own. Let’s look at a histogram based on pension amounts:

I find this interesting compared to the distribution seen for the Universities pension fund. In that plan, it was more like an exponential distribution, with the peak at the lowest amounts and dropping off in exponential decay.
For the teachers pensions, you actually see a rising number until you get a peak near $80K, and then it starts dropping off exponentially. This probably reflects differences between people who may dip their toes into the university system for pensionable experience, versus schoolteachers who may be more likely to stick around if vested. Just a conjecture.
Let’s try looking at the average pension for ranges of years of service.

This definitely shows a difference with the university system. In SURS, we had only a few with less than 5 years experience, but a lot ranging from 5 to 30 years of experience before drawing a SURS pension. In TRS, there is a pronounced peak of people with 30 – 40 years of experience. This was their career, as opposed to dipping their toes into a particular path for the last 10 years of their working lives.
I come from an extended family of a lot of public schoolteachers. This rings true to me.
But I’m only showing you the average pensions in the above graph. How about the range of benefits?

What you’re seeing here, in the blue box for each range of years of service is the 25th percentile to 75th percentile pension amounts. The thin line for each runs for the minimum benefit up to the maximum benefit.
I apologize for the distortion of the maximum pensions in there — that usually only represents one person. Probably some county superintendent (look, I’m willing to crunch numbers. I’m not willing to google every high-pensioned retiree in TRS.) You can see how “squashed” the blue boxes look — the 25th to 75th percentiles are fairly narrow, as distributions go.
To take a typical career length, the 30-35 years of TRS credit has pensions ranging from $49K at 25th percentile to $80K at 75th percentile.
The overall percentiles for everybody, all credit length, is $25K for 25th percentile up to $68K for 75th percentile. Obviously, this skews downward somewhat for those who do not spend their entire career in the Illinois TRS.
CONTRIBUTIONS AND FUNDED RATIO
Now we turn to the Public Plans Database.
What has the contribution history been?

If they got a bit of the 2004 pension obligation bond, I’m not seeing it. Yes, every year has been short-changed. 2010 less than other years for some reason. I will have to look at that later.
How has the funded ratio done?

Like SURS, it’s at about 40% in the most recent valuation. The improvement in the ratio between 2003 and 2004 makes me believe they did get a portion of the pension obligation bond proceeds.
Yes, I could look up the details of the Illinois POB issue in 2004, but why when I can just look at the numbers?
(And yes, I look at cohort mortality tables to remember when the Spanish Flu hit the U.S., why do you ask?)
UNFUNDED LIABILITY DEVELOPMENT
So now, the moment of truth: how has the unfunded liability developed?

As we saw with the other plans, the only time the unfunded liability went down was for 2004, the year Illinois issued pension obligation bonds. (Okay, it looks like it dipped sometime in the 1990s as well, but hardly noticeable.) So I guess they did get a piece of this action, though their share wasn’t enough to even meet the ARC for that year.
That’s really sad.
As noted multiple times before before, TRS contributes more than half to the unfunded liability of the five state pension plans:
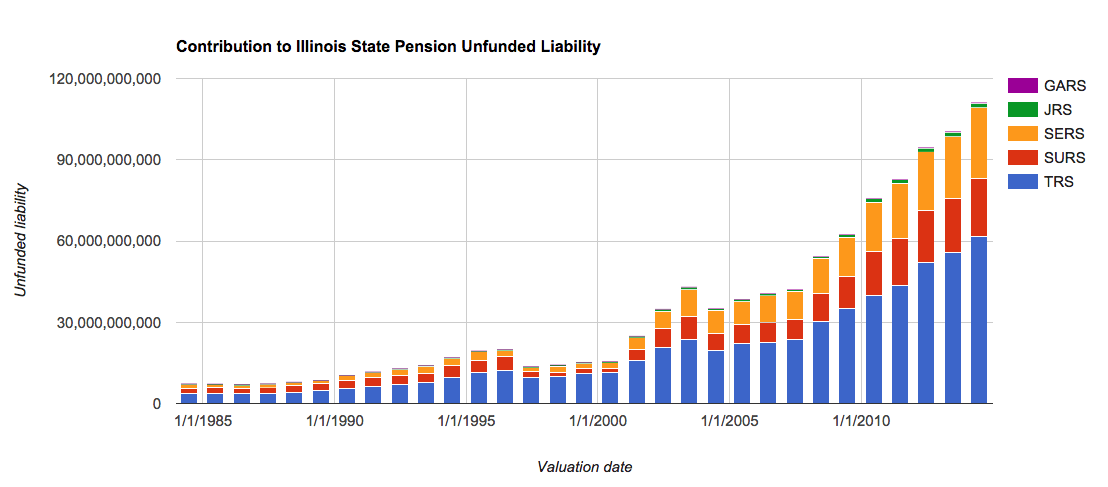
But is it really an outrageous contributor to the unfunded pension liability? Its funded ratio is better than GARS, JRS, and SERS after all….
….I will let you think about this for a bit, because I will return in a later post to try to come up with some metrics to compare the 5 plans.
I will also return to the other plans with some other numbers I didn’t have at the time when I originally looked at their trajectories.
Related Posts
Cook County Soda Tax: Persuasion and Comparisons - Why Not Tax Juice?
Sunday Sumo: Some Winning Moves on the Middle Day
Use Data Visualization Responsibly
