Dataviz: Public Pensions Assumed Rate of Return
by meep
Of course, if I’m having a dataviz week, I’m going to visualize pension stuff.
Using data from the Public Plans Database. I did this last year, but the 2014 year was incomplete. Also, my new datapull has 10 additional pension plans in it now.
If you’d like to check my work, the underlying spreadsheet can be found here on Google Drive.
DISCOUNT RATE BY COUNT OF PLANS
Let me do the first graph, showing the distribution of choice of discount rate:
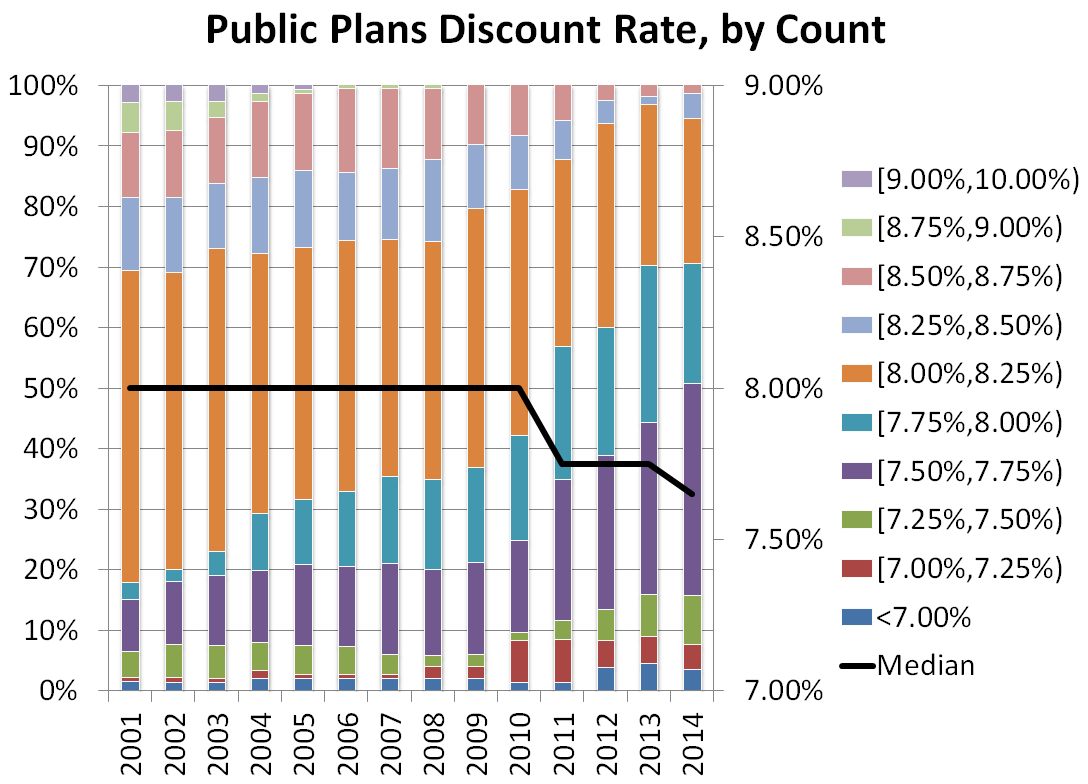
You can see that the median valuation rate (black line) was 8% for most of the history, and has come down to 7.65% for 2014.
Thing is, some of these plans are much bigger than others — I really shouldn’t count Calpers, the largest U.S. state pension plan, against the Montana Teachers Plan, say. Let’s weight these choices by size.
DISCOUNT RATE BY TOTAL LIABILITY
Yes, I know the choice of discount rate influences the size of the liability, but it can’t be helped.
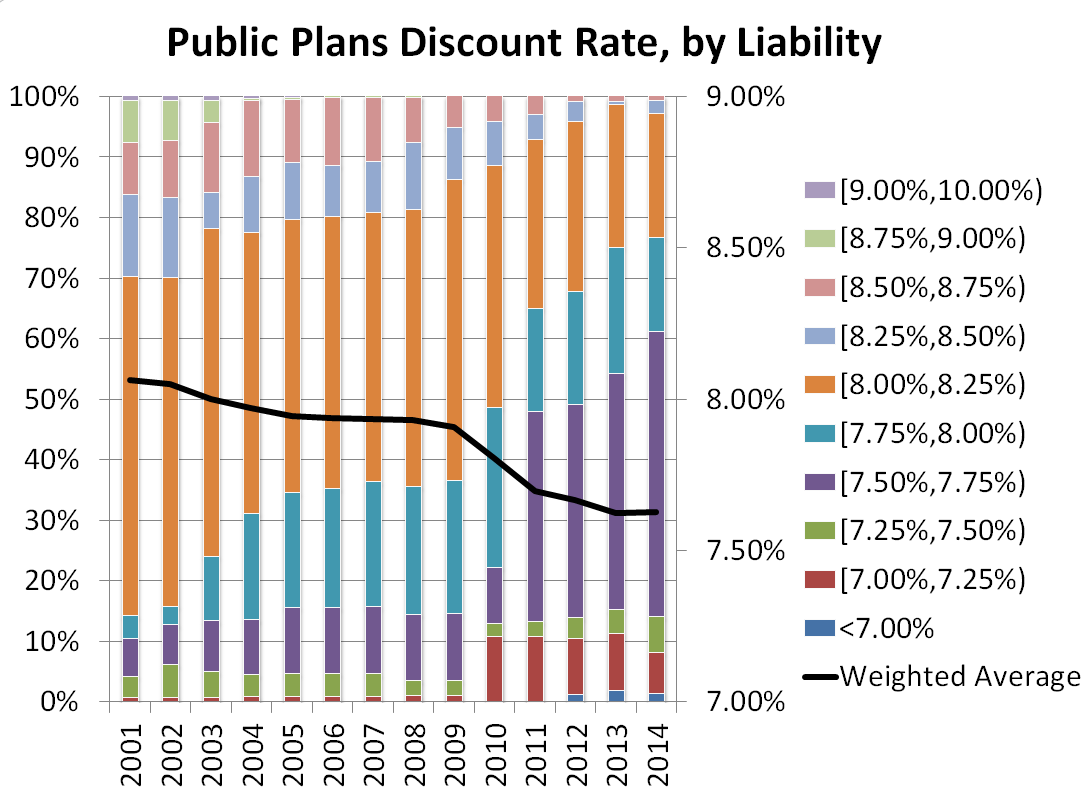
The average (weighted by liability) rate started out above 8% in 2001, down to 7.63% in 2014. Not too different from count to liability.
USING THE GRAPHS TO LOOK FOR INFO
That said, you can see some differences between the two graphs. In the weighted-by-liability one, you can see that there was a large change between 2010 and 2011, where the bar for the 7.5% – 7.75% bar grew greatly in comparison to the overall bar.
I dug into that, and found there were multiple movements between 2010 and 2011… a general sliding down, with 35 plans reducing their valuation rates. However, the movement we see in the bars primarily comes from the very large Calpers and Calstrs pension plans falling into the specific range.
It’s kind of interesting to make these graphs and dig into results. I do find it interesting that many plans decided to reduce valuation rates, even though there is nothing requiring them to do so.
COMPARE AND CONTRAST
Of course, that less than 50-basis point drop in valuation rates is nothing like the decrease in insurance company investment returns.
Figure 3: Gross Book Yields and Risk-free Rates (as Percent of Underlying Investable Assets) (from my article on life insurers in a low-rate environment
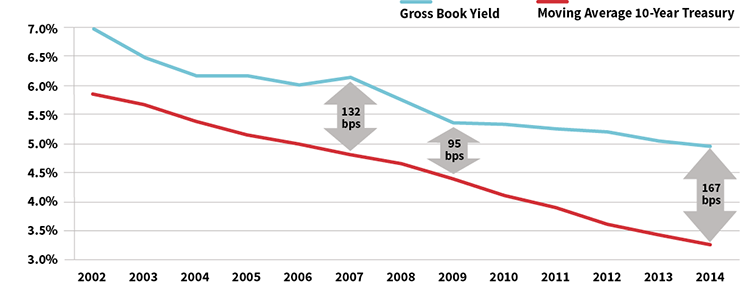
Over the same period, insurers went from a 7% return on investments down to 5%.
I have a feeling there’s still a ways to go on public pensions valuation rates.
Related Posts
Around the Pension Blogosphere
Meep's Data Visualization Evolution: Tile Grid Maps
Public Pension Assets: Our Funds were in Alternatives, and All We Got Were These Lousy High Fees
