One Bad Year? Comparing the Long-Term Public Pension Fund Returns Against Assumptions
by meep
As I noted a few weeks ago, we’re getting the reports on pension fund fiscal year results on the asset side.
WSJ: Market Rout Sends State and City Pension Funds to Worst Year Since 2009
Public pension plans lost a median 7.9% in the year ended June 30, according to Wilshire Trust Universe Comparison Service data released Tuesday, their worst annual performance since 2009 and a fresh sign of the chronic financial stress facing governments and retirement savers.
Much of the damage occurred in April, May and June, when global markets came under intense pressure driven by concerns about inflation, high stock valuations and a broad retreat from speculative investments including cryptocurrencies. Funds that manage the retirement savings of teachers, firefighters and police officers returned a median minus 8.9% for that three-month period, their worst quarterly performance since the early months of the global pandemic.
We can get into the specific fund performance, but it doesn’t much matter.
These are the results, as per Wilshire, for their estimated median return:
Public pension funds have hundreds of billions of dollars less on hand than they will need to cover future benefit promises. A record run in stocks afforded them a decade of relative breathing room. But even after a blockbuster median return of nearly 27% last year, many retirement systems remained underfunded with the growth in expected benefit costs outpacing the growth in assets.
That shortfall, along with aggressive annual return targets of about 7%, have led pension funds to embrace investment risk, with a median equity allocation of 57% as of June 30, according to the Wilshire data. A larger equity allocation increases funds’ exposure to stock-market moves; a rally in stock and bond prices in recent weeks stands to ease some of the pain of the past year.
….
“One year is like the pace of a mile in a marathon,” Christopher Ailman, investment chief of the California teachers fund, said at a board meeting last month. “Last year was so positive, it gave us such a nice lead, we could be flat another year and still have a 7% three-year return.”
I am going to return to this claim, by the way.
It is true, that the pension funds are intended to invest for the long term. We will see just how well they perform for that long term.
Changing assumed rates of return
ai-CIO: Average Public Pension Assumed Rate of Return Hits 40-Year Low
The average investment return rate assumption for U.S. public pension funds has fallen below 7.0%, to its lowest level in more than 40 years, according to the National Association of State Retirement Administrators.
Among the 131 funds that NASRA measured, more than half have reduced their investment return assumption since fiscal year 2020 as rising interest rates and other factors have contributed to more volatile investment returns.
The return rate assumption is a key valuation and funding assumption, driving pretty much everything else.
The higher that assumed rate, the bigger the drive to shift the portfolio into riskier assets, the smaller the pension liabilities look, and the less one contributes now on the theory that more money will be coming in later.
Related posts on these themes can be seen here:
July 2020: Classic STUMP: Public Pensions Primer—The Choice of Discount Rate and Return Volatility
July 2020: Classic STUMP: Public Pensions Primer—How Discount Rates Work
Sept 2015: Public Pensions Primer: Choice of Discount Rate Influences Results
Checking the history of assumed rates of return
For the following, I’m using data from the Public Plans Database, extracted on 12 Aug 2022, and focusing on fiscal years 2001 – 2021. All available data are included, no matter the size of the plan. For today’s analysis, I’m not weighting by plan size (I may do that in the future – I have done it in the past.)
In all of the following, I will plot by fiscal year, which for most plans runs from July 1 to June 30, but not all plans have the same fiscal year (which will appear when we look at 1-year returns). I use a jitter plot in Excel to show the distribution of rates.

- The jitter graph can do only so much for this dataset (I tried to jitter it a bit more, but it started looking really weird). There is a lot of clustering as many of the pension funds use the exact same assumptions. That’s not necessarily bad.
- However, that does mean the key percentiles often are exactly the same. In this graph, the yellow line is the 75th percentile, the light blue is the median, and the red line is the 25th percentile. Yes, sometimes the median and the 75th percentile were equal. Sometimes the 25th percentile and the median were equal.
- Over the years, the median has decreased from 8% to 7%.
Don’t get too excited over that quite yet.
One-year rates of return
Now we will start building up looking at how the pension funds have performed.

Three things I want you to note about this graph:
- First, the vertical scale for the graph ranges from -40% to 40%. I actually had to cut this off, because there were a few extreme funds that had 1-year returns that went over 100% for a few crazy years, and I considered them too much outliers to do anything with.
- Second, the very volatile results year-over-year. My graph ends with fiscal year 2021, not FY 2022 as the WSJ article above reports on. This has to do with how the Public Plans Database gets its data – they wait for the annual reports, so there’s a lag between the asset results until the annual financial statements get released.
- Third, you will see in some years there are two very noticeable clusters that are very far apart. 2009 is one year like that — this is totally due to different plans having different fiscal years. The majority of the plans have fiscal years running from July 1 to June 30, which is why FY2009 is down for most plans, because that includes the fall 2008 market drop. But some plans have a fiscal year that matches the calendar year (or something else entirely).
But the timing of the fiscal year doesn’t matter as much over long periods of time.
And pensions last for decades, not merely one year.
So let’s look at the longer-period performance.
Five-year rates of return
Now, for a pension, five years really isn’t that long. But it is a standard performance-measuring horizon.
For these, we’re looking at the annualized rates of return (geometric, of course!)

The range of results is much less (yes, I did restrict the axes again, but the extremes weren’t as extreme).
There is some volatility, but it’s not as volatile as the 1-year results, and one would expect that. Good. But we’re not quite there yet.
Ten-year rates of return
Here we kind of reach our limit on measurement, for a variety of reasons.

By the way, there were a few results that gave a negative (barely) 10-year result, but that really was an outlier.
The vertical axis is pretty stable at this point, and the difference in fiscal year timing is mostly obliterated.
There is still quite a bit of distribution in the results, and something to keep in mind is that the asset allocation has changed quite a lot over the 20-year period we’re looking at. In particular, there has been a large increase in alternate asset classes in these two decades, injecting a lot more risk into the portfolio.
Assumptions vs Reality
Let’s put it together, contrasting those 10-year results against the assumptions.
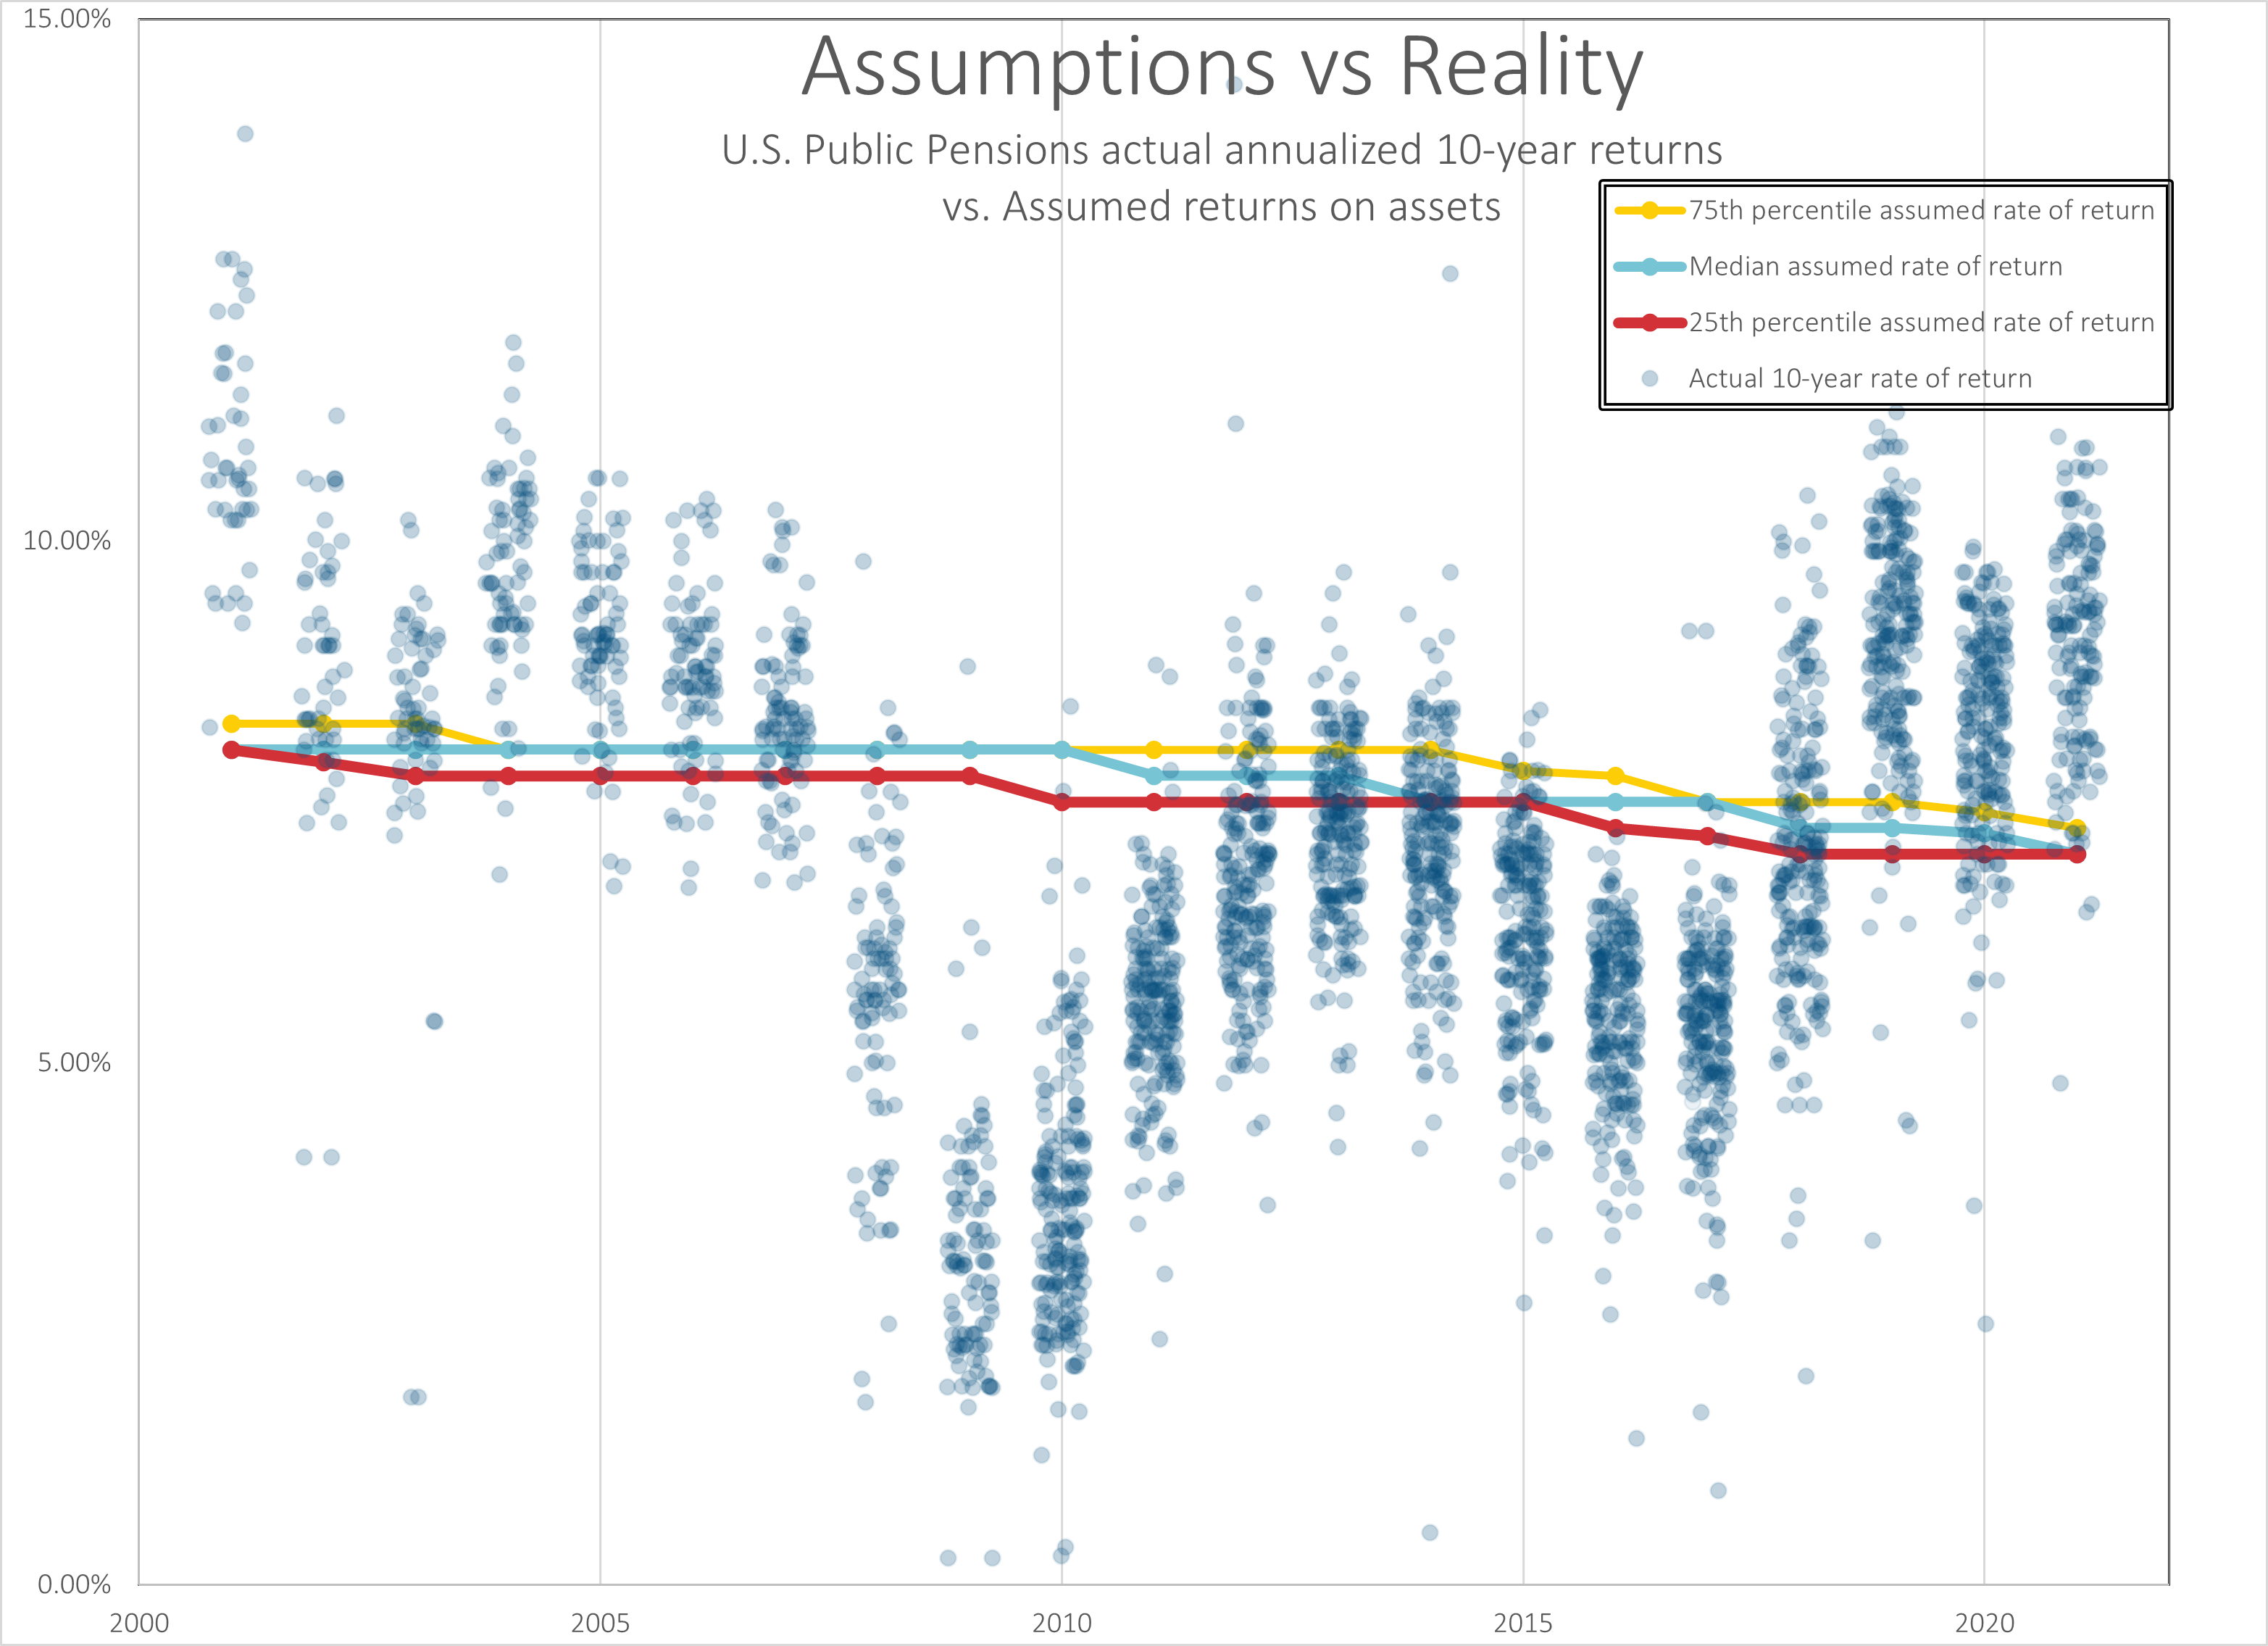
Those returns, even when looked at on a 10-year average basis, look a lot more volatile compared to those assumptions, eh?
Several years those 10-year averages were below those assumed rates of return, and those were years I knew we were in a bull market. But that was having to claw out of the big drop of fall 2008.
That might have some repercussions.
Related Posts
Connecticut Pensions: Pushing Off Payments Til Later Ain't Reform
Public Pensions Watch: Sometimes Politicians Do the Right Thing
PSERS Update: What if it's just sloppy processes?
