Rhode Island Pensions: Liability Trends
by meep
So we saw that Rhode Island assets have some issues when it comes to their long-term performance.
Let’s see what the liabilities are up to, shall we?
As before, there are two RI plans in the Public Pensions Database, and I’ll combine the two when it makes sense.
LIABILITY GROWTH
Let’s just look at the full pension liability to begin with:
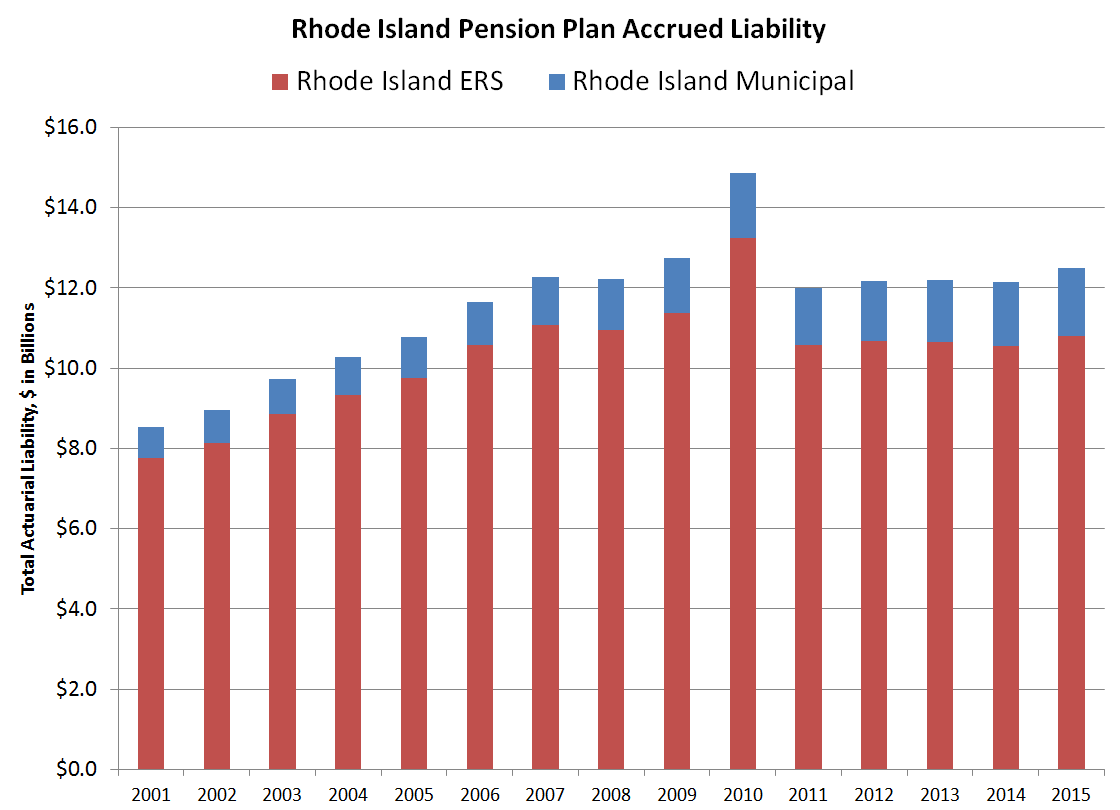
Isn’t that interesting? You see the drop from 2010 to 2011 — that’s the result of the pension reform, where the COLAs were cut.
This was the hit:
Rhode Island ERS — the accrued liability dropped 20% from 2010 to 2011 because of that change.
Rhode Island Municipal – the drop was only 12%.
Before that drop – from 2001 to 2010 – there was a CAGR (compound annual growth rate) of 6% for ERS and 9% for the Municipal plan.
Since the reforms passed, from 2011 – 2015, the CAGR has been 1% for ERS and 4% for the Municipal plan.
Quite the different growth rate, eh?
Indeed, the actuarial liability (total, not just the unfunded portion) for ERS is at about the 2008 level in 2015. The Municipal plan has been growing, and the 2015 amount exceeded the prior peak.
CONTRIBUTION PATTERNS
The Rhode Island plans have been “full funders” — they’ve been contributing 100% of what they’re “supposed” to be contributing over the history in the Public Plans Database.
So here is what that looks like:
Rhode Island ERS:

Rhode Island Municipal:

Hmmm. Steadily increasing ARCs as percentage of payroll. I’ve seen that pattern before.
Comparing the ARC to state revenue:
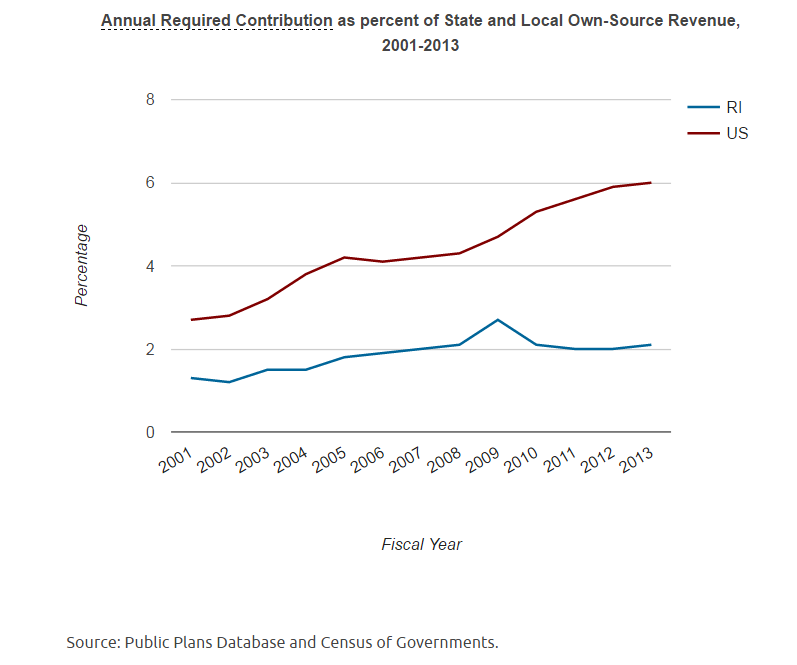
Hmmm, interesting. You can see the uptick in 2009, and then it drops back down to about a 2% level. That’s fairly low for national averages.
FUNDED RATIOS
So, they’re fully funding, right? That means their funded ratios have got to look great!
Rhode Island Municipal:
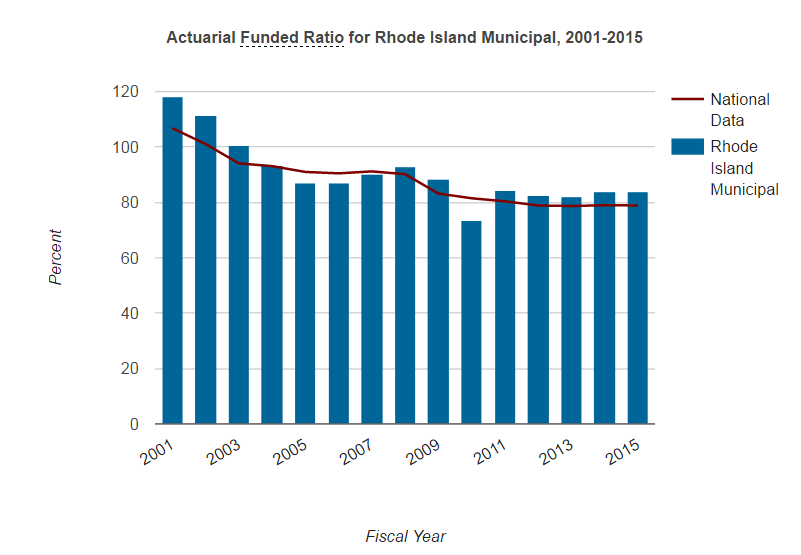
Uh… it’s above 80%, so yay? (just kidding)
The funded ratio has been at about the same level since 2011, post-reform, and hasn’t really shown any signs of improvement. All the while, the ARC increases as percentage of payroll.
Here’s Rhode Island ERS:

Whoa. That’s awful.
It’s pretty much the same pattern as the Municipal plan, but it started out underfunded at the prior top of the market. This pension fund does not seem to really be improving at all.
Let’s go to the funded ratio migration graph:

This is just the set of public pensions paying 100% ARC… though you can see many of them have very decreased funded ratios since 2001. The black line is if they maintained the same funded ratio… anything below that line show worsening (and the farther below the worse the movement).
Note that many of those plans moved down about as much as the RI plans did: 20 to 30 percentage points.
CASH FLOW
So let’s consider the cash flow graphs.
Rhode Island Municipal:

Eh, it’s about average. Negative cash flow is not necessarily bad.
Rhode Island ERS:
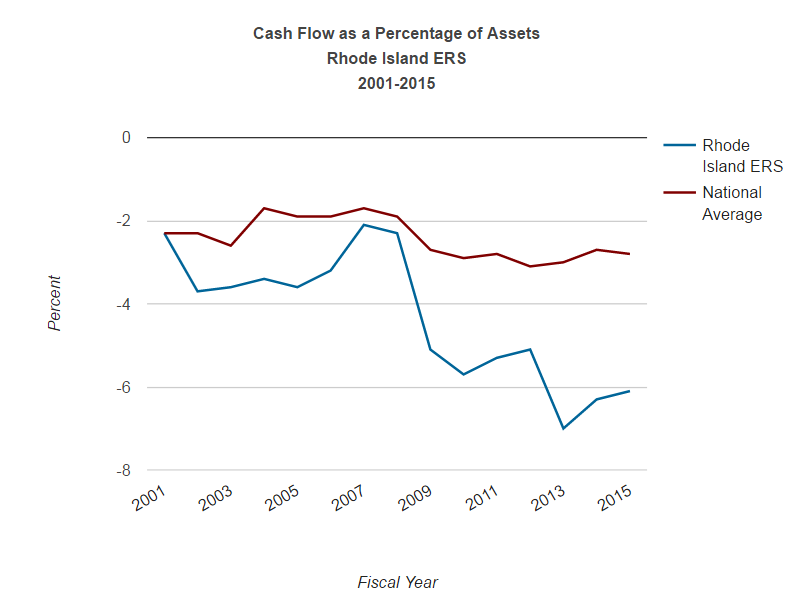
That’s not good. That’s not good at all.
So let’s bring this back: the Municipal plan isn’t all that bad on the liability side, though it does need to show an improving trend at some point. The ERS plan does not look that great.
And it seems the idea of luring in small, independent municipal plans into the big fund bucket may have some “unexpected” consequences for those plans.
It’s not at all clear that those plans really get a cost savings or performance boost by joining plans with these asset trends. Once the plans join the Municipal plan, they may have some kind of transition period, but they’ll be expected to pay 100% ARC like all the others.
And there was a note about the MERS having better benefits?
Yeah, small municipalities, you’re going to lose control of your pensions, and it’s not like the state is in a position to bail them out. This looks more like getting a nice pile of assets to be under state control.
I would consider well your alternatives before joining the big ole money pile.
Rhode Island Pensions spreadsheet
Related Posts
Update: Why Have "Full Contributors" Lost So Much Ground In Twenty Years in Public Pensions?
Asset Grab Bag: Whistleblower Award for Blogger, Private Equity Fees and Returns, and more
Priorities for Pension Funds: Climate Change or Solvency?
