Geeking Out: Testing Chicago MEABF to Destruction
by meep
What follows is an intellectual exercise to explore the space of an extremely simple cash flow model, and seeing if we can learn anything thereby. Yes, this is very artificial. But we’ll dig and see the point of this exercise.
Before I begin, let me thank my referrers:
- Truth in Accounting, for public finance issues — they’ve got their own public pension database
- Pension Tsunami – the grandaddy of public pension-focused sites* Wirepoints – for Illinois & Chicago info
- The Other McCain – a conservative blog, and in particular, Wombat-socho does a regular link-around to other conservative blogs
Howdy to my friends who come by my facebook links… (and I may post this one on facebook).
And away we go!
You can get the spreadsheet here.
QUICK CAVEATS AND DESCRIPTION OF THE MODEL
I described the model in a previous post, but to break it down simply:
- I take cash flows up to FY 2015 from the Public Pensions Database, broken into 4 categories: benefits outflows, non-benefit expenses outflows, contribution inflows, investment income
- I also take the market value of assets at end of FY 2015
- Each cash flow – benefits, expenses, and contribution – are assumed to grow at a constant percentage rate. Investment returns are a constant % of market value of assets.
- Once the assets run out, I have the base contributions remain level (so no more growth), and calculate the “extra” contributions needed to cover expenses and benefits.
- I project only to 2040.
That’s it. Pretty simple. Yes, I know, none of these items have constant growth rates… though if you look at benefit cash flows, those seem to be pretty steady in their growth.
Even so, part of the over-COLA benefit cash flow growth rate comes from the pig-in-a-python aspect of Baby Boomer workers retiring. But this is just, as one would say, an “informed guess”. I know the peak birth year of Boomers in absolute numbers is 1957/1958, which is why there is a spate of retirements round about now.
Yes, it’s an unrealistic model, but that’s the point — just distill to some simple and simply understood drivers.
EXPLORING PARAMETER SPACE
To begin with, I decided to explore “parameter space” – that is, vary the inputs to fill out a particular space of combinations. To wit: I had the benefit growth rate vary from 0% to 10%, the contribution growth rate vary from 0% to 10%, and the investment return vary from 0% to 10%. For any particular combination, the growth rates stay constant over the projection. (For simplicity, I kept the expense growth rate at 1% — it doesn’t have much effect on the results in general).
Then I recorded the year the assets ran out. Let me give you a flavor of the results:
Assuming 10% investment returns:

Assuming 7% investment returns:

Assuming 0% investment returns:

The worst situation of these possibilities, obviously, is having 0 investment returns (let’s not think of another market collapse….I SAID DON’T THINK ABOUT IT) — but what would be a reasonable assumption for benefit increases?
CONTRAST AGAINST HISTORY
As a reminder, here are the stats for the MEABF – on both a 5-year and 10-year basis.
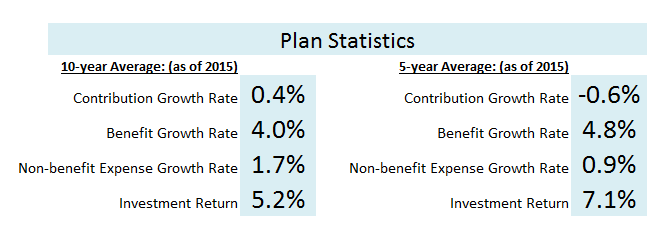
So, there’s been essentially no increase in contributions, and the benefit cash flows have been growing at about 4 – 5% annually.
If we assume that’s what we’re going to get — 4% – 5% growth in benefit cash flows — then at 0% investment return, the fund is going to run out before 2024, even if you increase the contributions by 10% per year.
At 7% annual returns, and 10% contribution increases (EACH year, mind you — in 10 years, 10%/yr growth rate means a cumulative 160% increase), you don’t even make it to 2030.
At 10% investment returns, and 10% contribution growth rate, you could make it past 2040… as long as the benefit growth rate is kept at 4%.
WHAT CONTRIBUTION GROWTH RATE DOES IT TAKE TO SURVIVE?
Of course, we get whatever we get with regards to investment returns, and for now, it seems that reducing the pension benefits for current retirees is off the table (but we’ll see about that).
That leaves us the contribution growth rate to play with, so my question becomes: what contribution rate does it take to get the pension assets to survive to at least 2040?
I’ve decided to assume a 4% or 5% benefit growth rate, to get an idea for a range of contribution rates needed to survive past 2040.

Let me explain what you’re looking at — I solved to the nearest 0.1 basis point the constant contribution growth rate where the assets wouldn’t run out before 2040, for the specific constant investment return.
Note that it requires at least 9% per year growth in the contributions.
I haven’t seen that Chicago is planning to do that kind of ramp-up of contributions.
What I have in the record is that Chicago has been contributing $289 million every year to the pension, for the last 5 years. If I assume a benefit cash flow growth rate of 4% and investment return of 7%, MEABF would need more than 10% per year increase in contributions.
By 2032, when the assets get close to 0 in that projection, that means $1.7 billion in contributions.
You think they’re anywhere near tp boost their contributions to the pensions by more than $1 billion/year?
Because that’s essentially what they need. And it’s mainly to cover current year benefits to retirees going out the door.
SENSITIVITY TO ASSUMPTIONS
Take a look — the difference of a single 0.1 basis point in growth rate.

It survives at 10.823% increase in contributions per year.

It does not at 10.822%.
This is what it looks like at a funded ratio of 33%, with contributions much less than the benefits going out. This is what an asset death spiral looks like — it requires a fairly aggressive increase in contributions to avoid pay-as-you-go.
You think that’s going to happen in Chicago?
I don’t.
You can get the spreadsheet here and do your own experiments. Feel free to adapt and explore — if you find something interesting, please let me know at marypat.campbell@gmail.com.
Related Posts
Wisconsin Wednesday: Pew Research on Its Ability to Weather Bad Experience
Which Public Pension Funds Have the Highest Holdings of Alternative Assets? Has It Paid Off?
Nevada Pensions: Liability Trends
