South Carolina Pensions: Investment Returns Recalc
by meep
Well. The internet swallowed up three drafts of this post, which I take as a hint. This is a followup from the previous post on SC pensions.
I will give the game away first and then show the work:
- SC Treasurer Curtis Loftis was right about SCRS being really low in ranking on 10-year returns in 2015
- I was right about SCRS being middle-of-the-pack in ranking on 15-year returns in 2015
- That’s because SCRS had a very good 2001-2005 compared to other public plans, and they had an awful 2006-2015 comparatively.
- I have discovered disparities in data fields in the Public Plans Database.
- I really don’t have the time to pull apart all my data sources. This is why I simply let you know what I used, link to my spreadsheets, and hope to be contacted if an error is found: marypat.campbell@gmail.com
I’ve had my nerding out posts in the past, but this… this is going to show you how an actuary tears apart a problem when they get annoyed that a detail isn’t right.
Actuaries are notorious for being detail-oriented people, often in a way that will simply infuriate everybody else around them. I am about to tear apart some details that were driving me nuts.

Now to begin.
THE DISPUTE
From my last post, remember I contrasted Treasurer Loftis’s slide:

With my histogram:
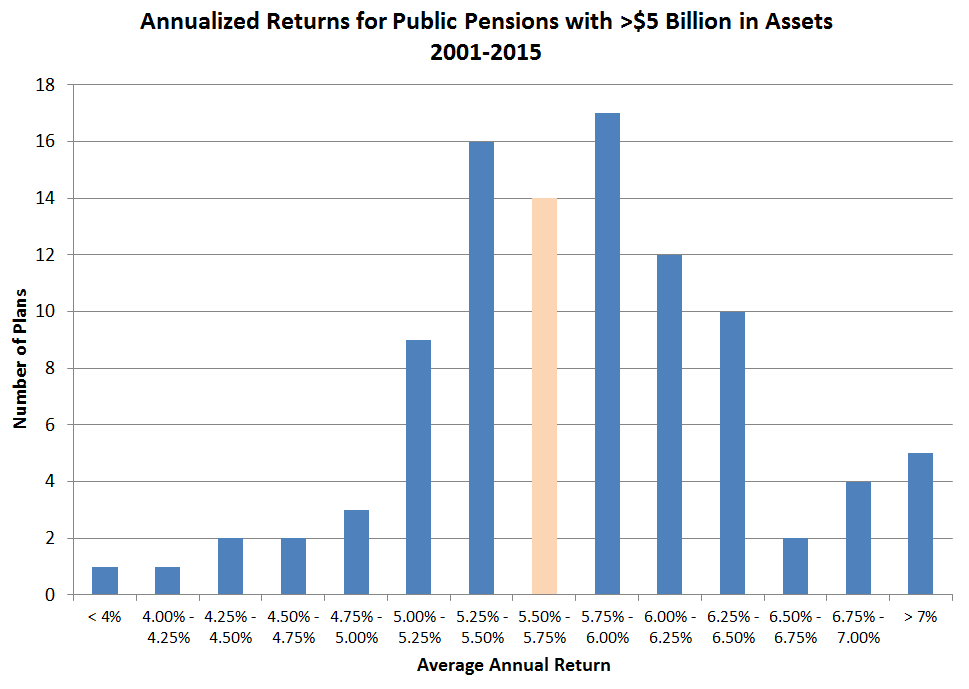
Note: we were looking at different things. Let us ignore the 1-, 3-, and 5-year results. That’s somewhat absurd to look at for a very long-term fund. The 10-year return is a bit more indicative… though it still is a short term to be looking at for a pension fund that is covering 30+ years of people working and then 20+ years of retirement.
So I re-did my histogram, first by pulling from the full database rather than the interactive page from the Public Plans Database.
Then I did histograms both from the 10-year returns as given by the database and calculated from the 1-year returns, filtering on plans at least $5 billion in assets. I ended up with 102 plans (different number from my interactive pull. Hmmm.)
10 YEAR RESULTS
This is what I got — again, the SCRS returns are marked by orange bars.
The pull direct from the database:

The graph from my calculated average:

Comparing the two distributions:

I don’t know why these numbers don’t match. I calculated the 10-year returns using geometric means (i.e., I did the time-weighted average returns) Just to be careful, I did arithmetic averages to compare. It still didn’t match. Maybe the database results were the dollar-weighted average — don’t know.
But let me point out: in both versions, SCRS is in the bottom 10%. BUT it wasn’t dead last!
It was second from last on one of the methods, and 5th from the last in the other. Okay, that’s pretty close.
Wyoming Public Employees had a lower return.
Okay, that’s close enough. Loftis was correct that the 10-year returns for SCRS were bottom-of-the-barrel.
15-YEAR RESULTS
But what about my 15-year return histogram?
Let me redo, using the 1-year returns.

Uh… that looks really different from my original histogram:
What’s going on? I will do more on the disparities before I get to what happened with SCRS.
OLD PERFORMANCE CAN BUOY BAD RECENT PERFORMANCE FOR A WHILE
SCRS had a really good run from 2001 – 2005.
The median 5-year return for plans 2001-2005 was 0.47% (using my calculated averages). Not 4.7%, 0.47%. Most of the plans had negative returns in the early years of the 2000s. If I do a histogram using my same bins as the others, this is what happens:

Uh.
Well, there are also 5-year returns in the database.

Hmmm.
Anyway, it looks like the ranking is about the same, even if the specific numbers are different.
Anyway, you can see why I tell you where I get my data, and give you links to my spreadsheets. here is my spreadsheet for this post.
So why did SCRS do so well from 2001-2005? Let’s look at the asset allocations:

I bet those high bond allocations helped in 2001-2005 — I did a quick check on Calpers, which had a very high allocation to equities in those years… just like most other pension plans. The pensions with high equities allocations got hit badly in 2001-2003.
So it’s not necessarily suspicious that SCRS did well in 2001-2005 compared to all the other plans. After all, they were doing something very different from the rest.
And now they’re doing something different from the rest in having a super-high allocation to alternative assets. Those 5 years of good returns mean the 15-year averages aren’t that bad… but the 10-year returns were awful, as were those shorter-term averages.
While I said the 1-, 3-, and 5-year average returns were silly to look at given the long-term nature of the pension plans, if we look at the rank ordering, it gives us an idea of the trend for current investment strategy compared to others.
And it looks awful for SCRS. Yes, there’s an asset-side problem.
ON RELYING ON EXTERNAL DATA
I’m going to indulge my detail-orientedness just a little more, but before I do that, a panel from the short-lived career of the Penguin henchman known only as The Actuary:

The authors of that two-issue story of Batman must have known at least one actuary. We often say such things. (If you’d like to see the details of the plot…about the funniest Batman story I’ve read.)
Heck, Actuarial Standard of Practice 23 on Data Quality says:
1.2 SCOPE
This ASOP provides guidance to actuaries when selecting data, performing a review of data, using data, or relying on data supplied by others, in performing actuarial services. The ASOP also applies to actuaries who are selecting or preparing data, or are responsible for the selection or preparation of data, that the actuary believes will be used by other actuaries in performing actuarial services, or when making appropriate disclosures with regard to data quality. Other actuarial standards of practice may contain additional considerations related to data quality that are applicable to particular areas of practice or types of actuarial assignment.
If an actuary prepares data, or is responsible for the preparation of data, to be used by other actuaries in performing actuarial services, the actuary should apply the relevant portions of this standard as though the actuary were planning to use the data, taking into account the preparing actuary’s understanding of the assignment for which the data will be used.b
This standard does not apply to the generation of a wholly hypothetical data set.
This standard does not require the actuary to perform an audit of the data.
If the actuary departs from the guidance set forth in this standard in order to comply with applicable law (statutes, regulations, and other legally binding authority), or for any other reason the actuary deems appropriate, the actuary should refer to section 4.
I’m not “providing actuarial services”, and if I were, I would go back to the original CAFRs on this matter, or even dig out the investment reports. This is a hobby for me. I’m not auditing this database. But I have found insconsistencies.
But data that are inconsistent really drives me batty. I would be unhappy if I couldn’t use the Public Plans Database because it was unreliable.
So I’m going to do a few scatterplots comparing my 10-year averages calculated from 1-year returns and the database amounts:

So…. for the 5-year returns, my calculations are lower; for the 10-year returns, my calculations are higher. The differences are about consistent, and the correlation looks really high. I calculated the rank correlation coefficient as well as the regular correlation coefficients — they’re all the same, about 90%.
So I wouldn’t rely on these numbers to many digits, but they are consistent enough in making comparisons.
Related Posts
Show Me (the Money) State: Missouri Tries a Pension Buyout
Calpers Myths vs. Facts: Page is Gone But The Internet is Forever
Divestment and Activist Investing Follies: What's Next? My Lunch?
