Mortality with Meep: Retrospective on Mortality Trends (and a wee bit about COVID)
by meep
As I mentioned in my prior post, for this week, as it looks like I have new readers, I want to give y’all a little taste of the themes on this blog.
Today’s is mortality.
By the way, the “twin” substack post for this is highly pared down. [Hmmm, artisinally curated.] If you’d rather read a shorter post, go there.
I’m a life actuary, which means I’m all about death. My first actuarial job was at TIAA-CREF (now called TIAA), focusing on their core annuity products (and I learned about some interesting, and surprising to me, long term mortality/longevity trends.) Since TIAA, I have worked at a reinsurance company and currently work in insurance research. I have been involved with project oversight groups concerning mortality modeling with the Society of Actuaries (here’s one of the reports I was in the oversight group for. There’s a followup coming this year.)
Again, to be clear: I work in life insurance and annuities. I can’t help you with your car or home insurance. (Also, I don’t sell these products and can’t tell you which companies to buy from. I can give you basic information about types of products, yadda yadda)
I’m about death. DEAAAAAAATH
I’ve even done some videos about mortality.
I’ve got 77 posts in the mortality category (now 78), and for a time I used to do “Mortality Monday” posts. When my husband, Stu, was diagnosed with metastatic prostate cancer, I stopped writing about mortality for a while…. but I did start back up after a time, as Stu is still going on, and I really like looking at mortality trends.
Happy mortality news
When I taught UConn actuarial science majors, they often told me they found their actuarial science classes depressing, because it was all about death and destruction. (Please don’t ask me how the actuaries are feeling about all the property damage in various cities.)
At least with mortality, there is actually a lot of good news… at least in the pre-COVID days.
Child mortality, amazingly, has been improving worldwide and continuing to improve, even though it was already superlow.
Good News for Wednesday: The World is Getting Better

Almost half of children born [in the U.S.] in 1800 didn’t make it to age 5. And now fewer than 1% don’t make it. That’s a 99% improvement in 215 years. But it wasn’t even over all those 215 years.
See the two blips?
1880 was a diphtheria outbreak, which mainly killed children.
1918 was the infamous Spanish flu pandemic, which killed across age groups, but hit young adults especially hard.
Anyway, the vaccines we get now are no joke. Pretty much all the diseases we give vaccines for can kill people, and have often killed the very young.
But not as much anymore.
But let’s look at the decadal improvement. I’m going to do this by decades (ending on 2010), and taking the percentage improvement. So a 10% improvement means a 10% decrease in the mortality rate over the decade.

The 19th century was a rough time to live (or, in this case, not live). While there was some mortality improvement for children up til the Civil War, that diphtheria outbreak caused disimprovement.
But check out 1930. From 1920 to 1930, there was an almost 50% improvement of mortality. Not a 25 year period, but a 10 year period. Child mortality dropped from about 17% to 9% over that period.
I didn’t point it out in this post, but look at the 2010 data point — even with child mortality as low as it currently is, with most kids dying from accidental causes, homicide (sorry, y’all), or cancer… there still was an over 10% improvement in mortality from 2000 to 2010. It still flabbergasts me. It’s not just breakthroughs with childhood cancer (which is rare, but because kids die so infrequently of any cause, it’s a top cause of child deaths), but a reduction in accidental deaths. YAY SAFETY!
Child mortality is not the only great improvement. Heart disease mortality has come way down.
In addition, cancer survivor rates have greatly improved, due to both better detection and treatment.

Mysterious Caribbean deaths, mysterious Russian deaths, and not-so-mysterious pension fraud deaths
[Yes, I’m starting with the light stuff…. to draw you into my dark side.]
Dominican Republic deaths. Do you remember that particular kerfuffle from 2019? Man, in the Before Times, we would get worked up over a handful of deaths.
[Thinks for a moment….. moves on]
I got a bunch of posts out of it:
- 19 June 2019: Mortality with Meep: How Many Deaths Before it’s No Longer a Coincidence? – this is the post for geekery, in that I try to figure out some probabilities for “suspicious deaths” — with the following statement: ‘So, if 225 Americans died in the DR in one year, I might start to get suspicious.’
- 20 June 2019: Mortality with Meep: Dominican Republic and Raw Death Rates
- 22 June 2019: Mortality with Meep: Even More Dominican Republic Deaths
- 24 June 2019: Mortality with Meep: People Continue to Die in the Dominican Republic and the PR Problem Continues
- 5 July 2019: Deaths in the Dominican Republic: Bad Booze?
- 10 July 2019: Deaths in the Dominican Republic: Westchester Woman Dies
- 15 July 2019: Deaths in the Dominican Republic: How Many are We Up To Now?
Here is my problem with these — it’s the count. A lot more than 11 or 12 American tourists had to have died in the Dominican Republic over the past year (my prior figuring that likely a few hundred die every year).
I already flagged a few of the ones that were not mysterious at all. This one claims 12 “mysterious” deaths, and others had claimed 11. Who the heck is keeping this list? Can we have a central clearinghouse indicating which deaths are mysterious and which are not?
I believe the State Dept., etc., when they say that there’s not an uptick in deaths of tourists in the DR. It’s just that it’s easy to find a “pattern” when this stuff happens all the time. It’s like any media-fueled “trend” (shark attack!). You just decide to publicize something that happens often enough that you’ll get a report at least once a week. So you can keep feeding the media coverage!
I think, ultimately, nothing much came of the DR stories. They had bad PR for a bit… and then it went away. Some of the deaths being written about had occurred over a year before, and one of the stories had to do with cheap, botched cosmetic surgery. Plenty of the accidental deaths in DR were not mysterious at all.
Mortality Monday: Suspicious Russian Deaths
Before I get into this topic, there is a story going on right now about a Putin opponent possibly being poisoned. I am an admin for the Vladimir Bukovsky group on facebook (I apologize if the link doesn’t work – but facebook is screwing around w/ its code, etc.) and I was involved in the official English publication of Bukovsky’s Judgment in Moscow. Those of us in these groups know how so many political prisoners have been targets of either character assassination (by figurative poison) or actual assassination (by literal poison). So there is a reason to suspect the deaths of prominent Russian political people.
But separate from that, male Russian life expectancy has sucked. Hard.
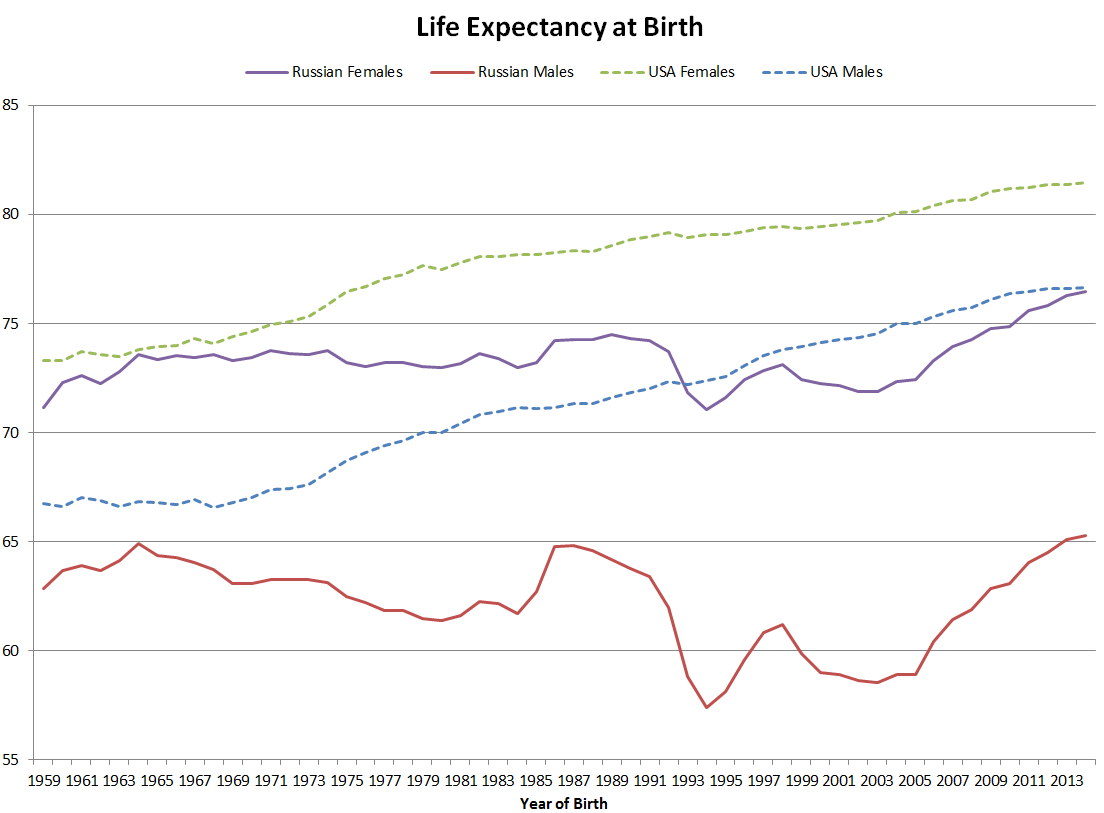
Russian men have a life expectancy of more than 10 years less than American men. That’s bigger than the black-white racial gap in life expectancy in the U.S. A lot bigger. Like, three times bigger.
A related post: Russian Retirement Age Raised Past Death? Let Me Actuary-splain…
The weirdest one of all: Mortality with Meep: How to Get Lots of Supercentenarians? Pension fraud!
It involves an amusing story about pension fraud in Japan, where the person got caught out because he “officially” became the world’s oldest living man…. except for the fact he had died decades earlier. I’m not joking – he had died over 30 years earlier.
I had covered the pension fraud angle in Tales of Pension Fraud: Hidden Deaths and Elder Abuse. It turns out after the “oldest man” debacle in Japan, they actually started checking and finding out a lot of their supposedly very long-lived Japanese pensioners had been dead for quite some time.
Political mortality
I started doing this before this blog. In September 2008, I calculated John McCain’s life expectancy (on my livejournal). It links to things that no longer exist, but here were the results:
Survival probabilities for 72-year-old man:
to age 77: 87.7%
to age 81: 74.5%Now, given McCain’s cancer status, it may not be appropriate to use this table, but given the level of healthcare he has access to, and his long-lived mother, and his general health status aside from the cancer, it might not be too bad. Say this is the upper range for survival probabilities.
McCain was 81 at death, in 2018. Of course, considering the stresses of office, he may not have survived two Presidential terms, had he been elected President and then re-elected.
I’ve done more calculations of both survivorship probabilities for Presidents and Supreme Court Justices since that 2008 post. Let me stick to the STUMP posts.
- August 2015: Presidential Interlude: What are the Chances? – that was when the oldest candidate was Bernie Sanders, at age 74. Now (in 2020), Trump is 74 and Biden is 77.
- September 2016:Actuarial Nuggets: Public Pensions and Financial Economics, Presidential Mortality, and More
- February 2017: Mortality Monday: Supreme Court Probabilities
- April 2017: Mortality Monday (with a little Trumpery): Supreme Court Probabilities Take 2
- July 2018: Supreme Court Mortality Projection Update!
- February 2019: Presidential Mortality: Bernie Running and Link to Retirement Planning
- January 2020: Presidential Mortality: 2020 Update — These Candidates are Old
- March 2020: Presidential Mortality: Evaluating a Biden-Sanders Ticket – obviously, this didn’t happen. Kamala Harris is very unlikely to die in the next 8 years, so this is all moot.
General U.S. mortality
Being in the U.S. (and we’re pretty important, you may have heard – the third largest country by population), I spend a lot of time thinking and writing about our mortality trends. I predict and also look backwards.
In February 2017 I posted: Mortality Monday: How Many People Will Die in the U.S. in 2017? – that was from February 2017. Here was my graph:

Looks like I didn’t link my spreadsheet, but I just grabbed death data from WONDER at the CDC for 2017. I had estimated about 2.9 million Americans died from July 2016 – June 2017, but I’m going to shift it for January 2017 – December 2017 (because it’s simpler).

=squint= well, the shape is right, but it looks like I got my base wrong somehow, because the actuals are lower than the projected. Maybe the projected mortality rates were too high.
Mortality with Meep: Top Causes of Death – Raw Numbers
A few graphs from that one:


Those are not rates. Those are the actual numbers of 2017 U.S. deaths by causes. A lot of people have no clue, getting very hung up on rare causes of death.
Here, have a video where I talk about how the media talks about causes of death:
Some more U.S. trends:
- RIP, Boomers: Death Comes For Us All – inspired by the deaths of Lemmy from Motorhead, David Bowie, Alan Rickman, and Glenn Frey, all of who died near each other in time.
- Death Comes for Us All, Part 2: Expect the Wave (that will take decades) – inspired by my grandma, who, on her last birthday, I explained why she saw far more obits for people 20 years younger than her than people her age. Yes, I used to talk to my grandma about mortality trends. She would tell me stories of gruesome murders. I miss my grandma. (“…. and they never did find his head….”)
- Mortality Monday: When Do People Die? – this is about month and day-of-the-week for deaths.
- Mortality with Meep: Major U.S. Mortality trends 1955-2017
- Mortality with Meep: Baseline U.S. Mortality Stats for Comparison
- Mortality with Meep: q_x – UPDATED WITH CONTENT FROM STU
A graph (recommended by Stu) from that last post:

Mortality got worse for Americans age 20-40 from 2004 to 2015. It improved for most other age groups.
COVID-19 mortality
Before I post COVID-related mortality, look at this post from October 2018: Get A Flu Shot: Last Year’s Seasonal Flu Was the Worst in 40 Years
“An estimated 80,000 Americans died of flu and its complications last winter, according to the US Centers for Disease Control and Prevention. This means it was the deadliest season in more than four decades — since 1976, the date of the first published paper reporting total seasonal flu deaths, said CDC Spokeswoman Kristen Nordlund.”
…..
Check out that spike. Even with some relatively nasty flu seasons, we have never gotten near anything like the Spanish flu pandemic since 1918. And that pandemic has nothing on what the Black Death was like.

By the way, we are still nowhere near 1918 Spanish flu pandemic levels for mortality, and I would hope not given it’s a century later. There are huge differences in the mortality patterns of the 1918 pandemic and the current one, the biggest difference being the age profile of those dying of COVID-19 being skewed very old, where the 1918 pandemic was skewed more towards young adult mortality.
- 2 March 2020: Pandemic: Current Stats of COVID-19, Spanish Flu, and WASH YOUR HANDS – turns out, you should’ve worn goggles and a mask, but we didn’t know at the beginning of March. It’s not clear to me that hand-washing or hand sanitizer has done anything re: COVID-19.
- April 2020: Know Your Models: COVID-19 . Right now, I just want to note that nobody is looking at these models in September 2020. Isn’t that interesting? Think about why. (Simple: these models have performed horribly)
- 21 April 2020: Mortality with Meep: Excess Deaths And Coronavirus
- 7 May 2020: Mortality with Meep: Excess Deaths and COVID-19
- 3 August 2020: Mortality with Meep: On Florida COVID Deaths and Reporting Lag
- 27 August 2020: Mortality with Meep: U.S. Excess Deaths Related to Covid Update to August 27, 2020

Mortality sex gap
This is one of my favorite mortality topics because there are all sorts of odd patterns one gets in sex differentials in death.
Mortality Monday: The Sex Gap in Death
Here is a nifty graph:

You can see there is some weird stuff going on at particular ages….you can check out the post to see what it is, but you should think a bit before clicking over. I bet you can figure it out before you get there.
Graph Week: The Mortality Gender Gap Among Workers
I like doing graphs:
Miscellaneous Mortality Geekery
In the following, I’m often trying to figure out probabilities of things — like how likely nobody died on Prince Edward Island for one day.
- Mortality with Meep: Student Deaths at a Large University
- The Return of Mortality Monday and RIP, President GHW Bush – when I decided I wanted to have fun with mortality again
- Mortality Monday: How Young is “So Young to Die”? – on death percentiles
- Having Fun with Mortality: The Day Nobody Died, the Oldest People Keep Dying, and Don’t Drink and Walk – PEI should have plenty of non-death days.
- Mortality Monday: Defamation Lawsuit about Mortality Rate Reporting – this one involves CNN and risk-adjusted mortality rates. I see this sort of error all the time in mortality reporting.
- Mortality Monday: Broken Heart Syndrome – a well-known effect (well known among life actuaries, that is) which most people don’t know about
- Geeking Out: Public Pension Mortality Assumptions
- Mortality with Meep: Cohort vs. Period Mortality Tables

- Mortality with Meep: Guessing at Trends
- Mortality with Meep: No, Retiring Later Doesn’t Make You Die Sooner… or Later
- Comparing Murder Rates: Fact Check – I fact-checked Nate Silver in this one – he was within spitting distance, but it still was a bit misleading.
- STUMP Classics: The Many Deaths of Sean Bean – a reworking of an older post, I had way too much fun making graphs of Sean Bean’s mortality experience.

- Mortality with Meep: Death Distributions and Survival Probability – there’s a RBG angle to this… but not really.
- Teachers Appreciation Week: Public Teacher Mortality
- Mortality with Meep: Some Mortality Trends in the Storyline Game
- Mortality with Meep: No, Safety Officers Don’t Die Younger than All Other Workers which has the followup Fixing my Graphs: Redo of Life Expectancy Graphs from This Morning’s Post
- Retirement Crisis Solution: Kill the Elderly (note: I am being sarcastic in this last one — but, I will also note that COVID-19 has hit the elderly, especially those in nursing homes, particularly hard)
I understand my particular interest in mortality trends may not be to the taste of most, but don’t worry: I put it right in the title, so you can easily skip the mortality posts.
Enjoy!
Related Posts
Geeking Out: On Life Expectancy and Conditional Expectation
Young Adult Mortality Trends, 1999-2021 (provisional), Ages 18-39 -- The Recent Millennial Massacre (Part 1)
Movember Fundraising: Men and Suicide
