Taxing Thursday: A Retrospective of Soda Taxes, the Amazon Tax, SALT CAP ZERO, and More!
by meep
For this “last week of summer”, I’m having a bit of fun going over the themes of my blog. So far, we’ve had the 80% funding myth and mortality.
And of course, as certain as death, there’s taxes!

Taxes aren’t really my thing (yes, I’m more in the “taxation is theft” gang, but I live in Westchester County, NY, one of the highest-taxed areas in the U.S. By deliberate choice. So obviously, I have a pretty high tax tolerance in practice. But I expect services for those taxes.)
However, as I look at my top subject of public pensions, taxes are closely related, so I needed to touch on those. For a while, I committed to a weekly Taxing Tuesday post, but I just can’t keep it up. Unless I get another juicy dumbass tax saga like….
Soda Taxes
As dumb taxes go, I love soda taxes for analysis. I don’t drink any soda myself (except for plain or lightly flavored soda water, aka seltzer), and the way these taxes have been implemented have been really idiotic. First, the claim is that sugary sodas are making people fat. But then some soda taxes are imposed on Coke Zero or Diet Dr. Pepper. Second, when comparing some of the taxes to booze taxes, you find beer is taxed more lightly. As a beer drinker, I’m fine with that.
But the main thing is that soda taxes are often imposed in an oasis where surrounding counties and cities can take advantage of an influx of new customers wanting cases of Pepsi.
My favorite dumbass imposition of the soda tax was Cook County in Illinois – the county Chicago is in. I think pushing this tax sunk Toni Preckwinkle, who was the candidate against Lori Lightwood for mayor of Chicago.
I’m going to try to be selective about which soda tax posts I’ll put here, because as much as I enjoyed myself… maybe you won’t find it so fun.
No, I lie, I’m going to link them all.
- 25 July 2017: Illinois and Chicago Round-Up: Soda Taxes, Holding Legislation Hostage, Tiffs over TIFs and More!
- 6 Aug Sunday Dumpery: Cook County Soda Tax, Chicago Pension Funding, and More
- 9 Aug Cook County Soda Tax: The Current Mess
- 13 Aug Cook County Soda Tax: Somebody Please Make It Stop
- 16 Aug Cook County Soda Tax: Dear Lord, It’s Not Dead Yet
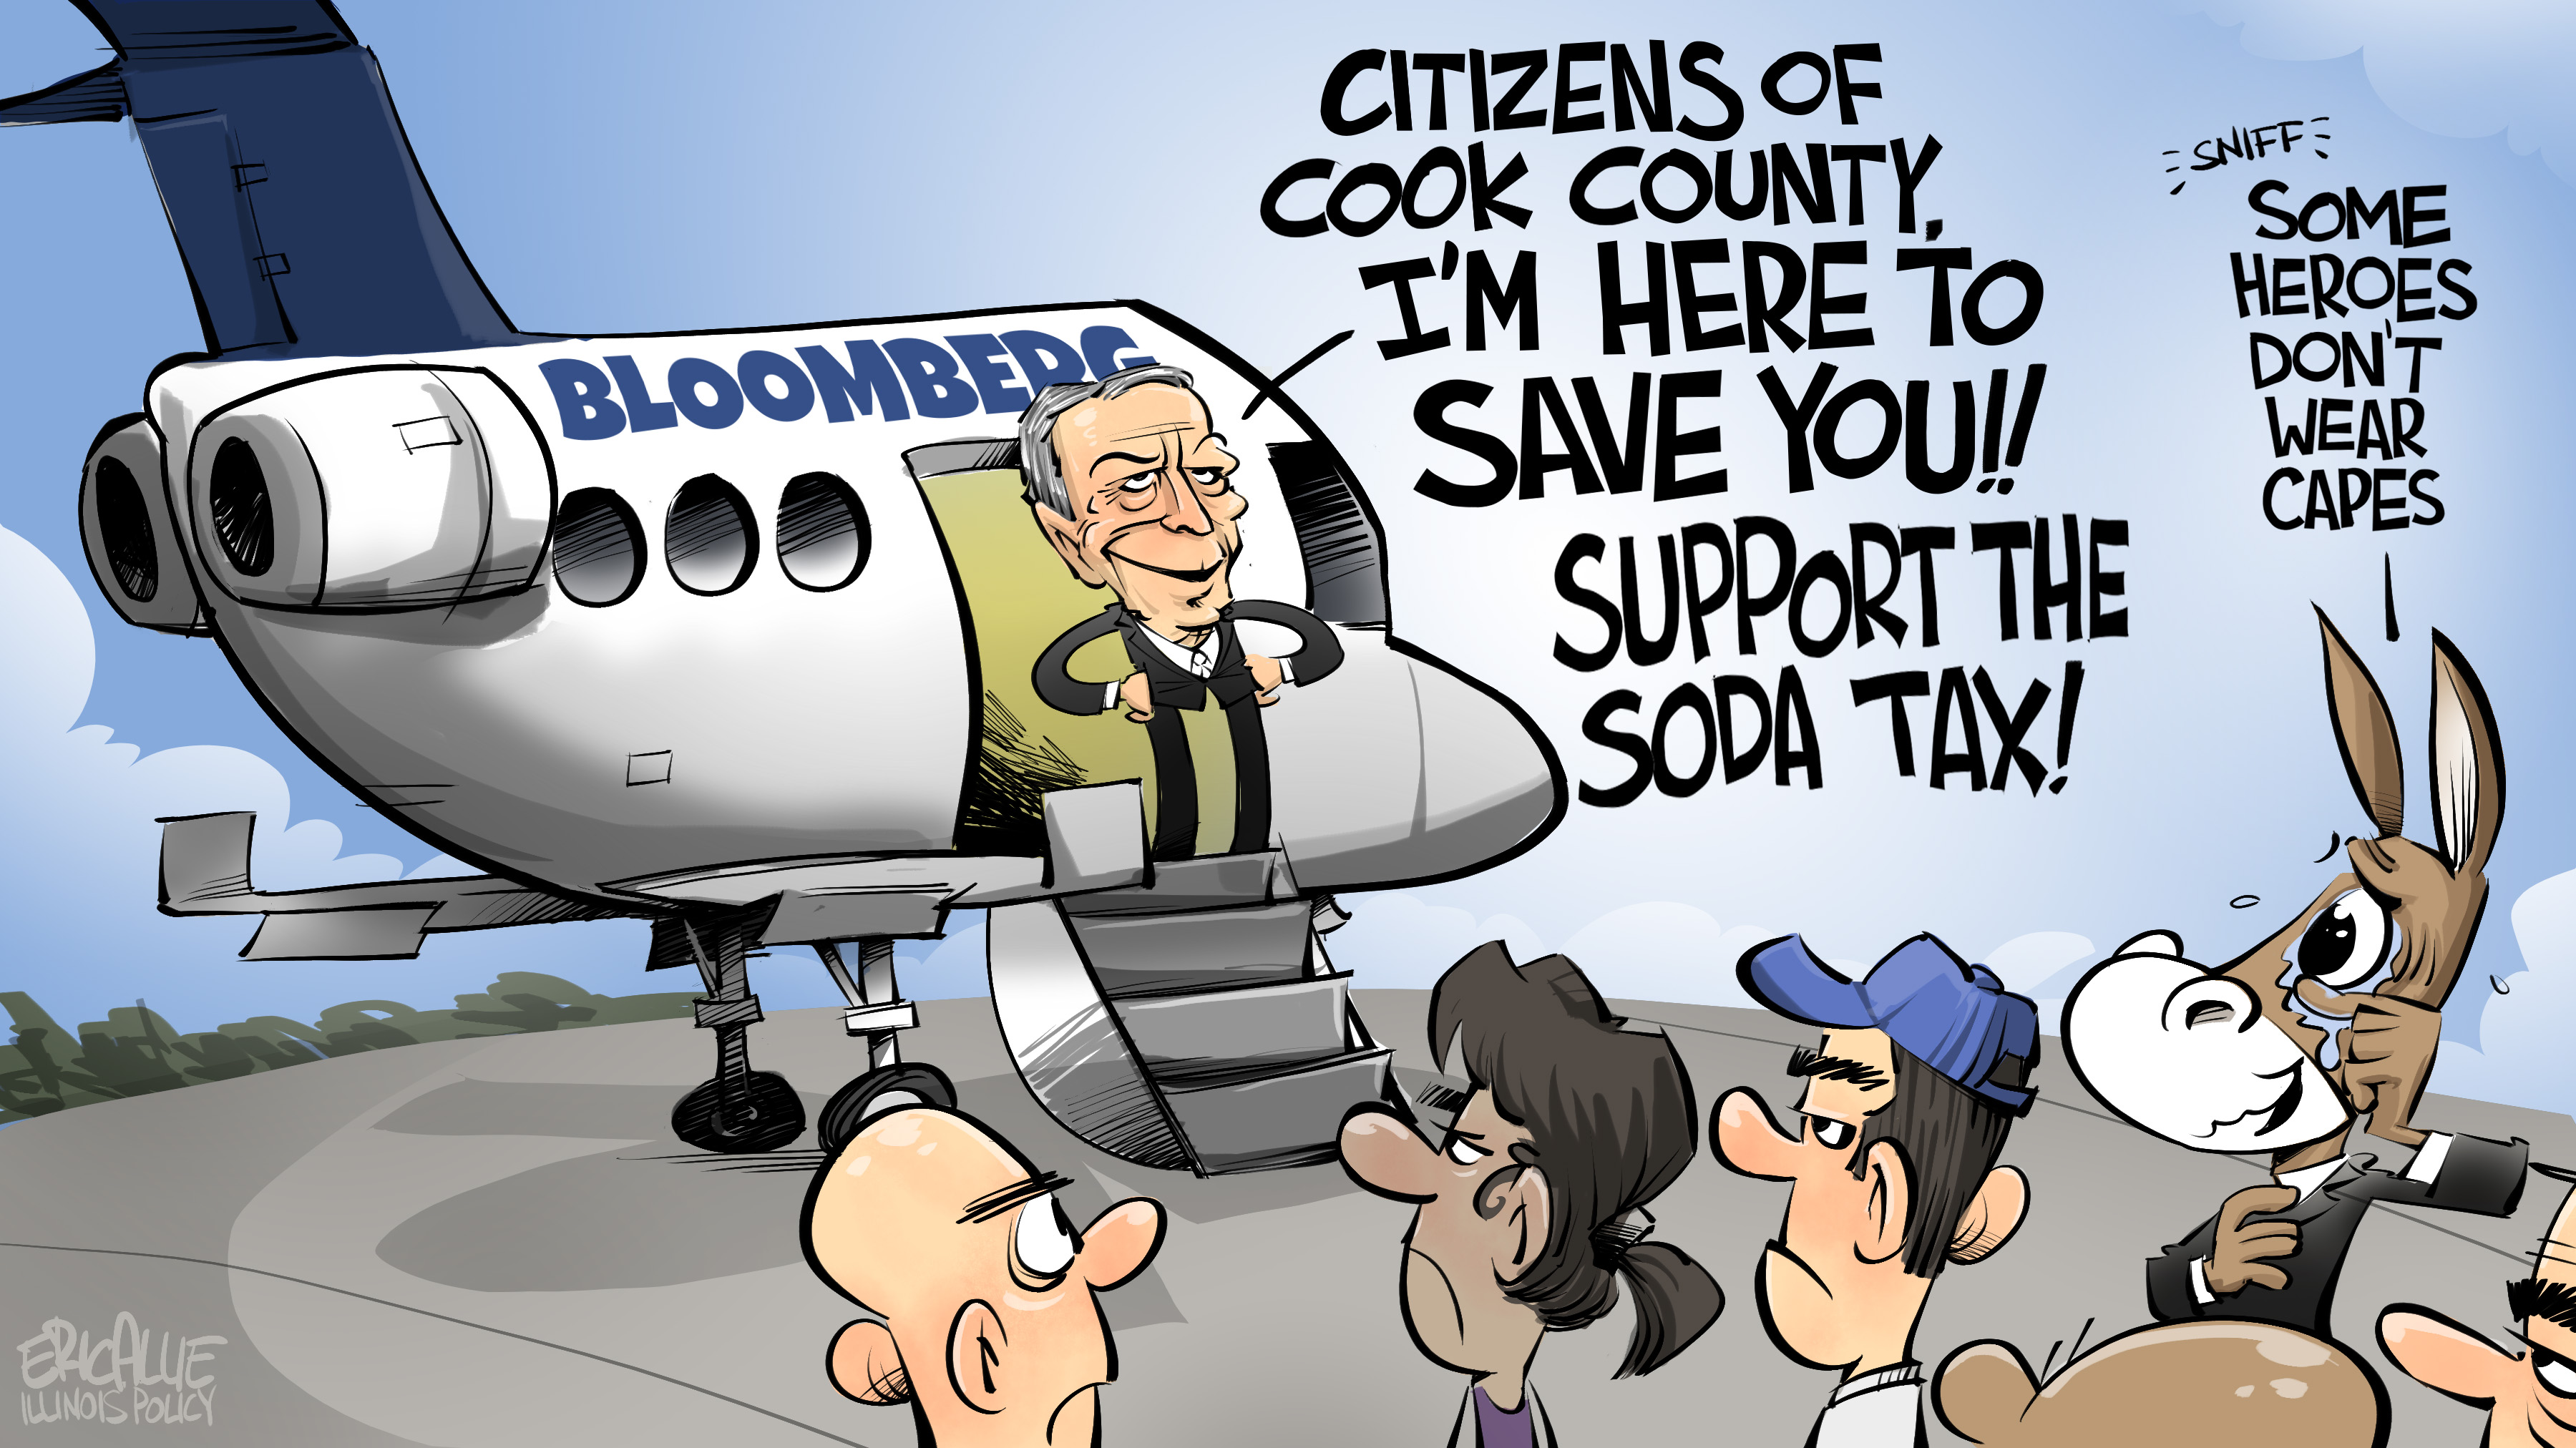
- 17 Aug Cook County Soda Tax: Look Who’s Come to Save the Day!
- 18 Aug Cook County Soda Tax: Persuasion and Comparisons – Why Not Tax Juice?
- 20 Aug Sunday Dumpery: Yes, It’s The Soda Tax – What’s It To You?
- 23 Aug Cook County Soda Tax: My Relief (and announcement)
- 27 Aug Sunday Silliness: Soda Tax, Sierpinski Spreadsheet, and Swinish Puns
- 28 Aug Monday Sweetness: OF COURSE MORE SODA TAX
- 30 Aug Soda Tax Gone Global: Is It Sweeps Week Yet?
- 3 Sep Sunday Silliness: Cook County Soda Tax Keeps Limping Along
- 11 Sep Soda Tax Follies: Choices Have Consequences
- 20 Sep Soda Tax Soda Tax, oh Soda Soda Tax: Bah Dumb Dumb Dumb
- 23 Sep Soda Tax Follies: The Backstory of Preckwinkle and More
- 28 Sep The Never-Ending Soda Tax: The Saga
- 5 Oct Soda Tax: Here He Comes to Save the Day!
- 6 Oct Soda Tax: THE BUDGET RECKONING
- 7 Oct Soda Tax: I BETTER POST THIS WHILE IT STILL EXISTS
- 10 Oct Soda Tax Sunset: Toasting the End of an Era
- 16 Oct Cook County Soda Tax: Juuuuust One More… Come On….
And I did a final Cook County Soda Tax post here: Pour One Out for the Cook County Soda Tax , when the Cook County soda tax finally stopped in December 2017.
awwwww the end of a very short-lived era. I will write my last soda tax post and have a drink. Of a Dark & Stormy, which has ginger beer
— Mary Pat Campbell (@meepbobeep) October 10, 2017
Okay, I guess I do drink sugary soda, but only as a mixer.
My favorite comment I made during the saga:
Nobody was ever fooled that it was about the children, an evil right-wing conspiracy, or whatever.
It’s all about money.
It usually is.
But by all means, attack fellow Democrats for being in the pocket of BIG SODA. I think that will be a fabulous tactic.
(I may not have your political interests in mind, Preckwinkle. Just in case it wasn’t clear.)
Mind you, Cook County wasn’t the only place to impose a soda tax. I have had other soda tax-related posts, not involving Cook County, but Cook County was the worst implementation of such a tax. There were so many operational problems with it, and how it was assessed was completely idiotic. Some places seem to have been successful with soda taxes, but mainly successful as a revenue source. Not in making people lose weight.
The soda tax saga came at a good time for me, as August 2017 was when Stu was diagnosed with metastatic prostate cancer.
I imagine the people of Chicago right now are longing for the times when the worst they needed to think about was soda taxes. (That is misleading… the homicide rates in Chicago at the time were horrid. But let’s stay away from death in this post. Taxes are enough.)
Amazon Tax
Now we move to Seattle and its own particular tax stupidity. When you have outright socialists on your town council, you’ve got to expect asshattery such as this.
In this case, I’m going to start with the last Amazon tax they’ve attempted.
July 2020: Taxing Tuesday: Seattle Returns to Its Dumbass Idea of an “Amazon Tax”
Recap of 2018 Seattle head tax attempt
Here is the nutshell version:
- A socialist Seattle City Council member thought it would be grand to do a per-employee tax on Seattle companies
- The city council passed it in Fall 2017
- This did not go over well either with local companies nor voters, who got together a petition to rescind the tax via ballot referendum in spring 2018
- Then in June 2018, the city council rescinded it to head off the ballot initiative
- Later in 2018, it was unshockingly revealed the council would try again when people weren’t looking……
The two people who did not vote to overturn the head tax [in 2018] were the socialist council member who proposed the head tax & the council member who proposed the payroll tax that just passed here in July 2020.
…..
Note: the pro-head tax people are not a large crowd, even if they are the types to set up an “autonomous zone” in Seattle itself. It was not put on the November 2018 ballot, by the way. I don’t know if anybody actually tried to even start a petition.
This is plain stupid to try again in the middle of a pandemic that makes companies realize they don’t need to be tied to a city.
I mean, all these tech companies have made a point these last several months to realize their employees can work from anywhere. They don't have to physically be in Seattle.
— Mary Pat Campbell (@meepbobeep) July 7, 2020
Not in Seattle… no tax. Pretty simple.
Commercial real estate is, shall we say, in flux at the moment. If Seattle is going to remain nuts for the foreseeable future, I’m sure that Amazon knows how to ignore sunk costs and get the hell out of town. It could simply by skinnying down the workforce physically in Seattle. The highest-paid execs might move to Colorado or Texas or someplace much more amenable to their wallets.
The more highly-paid the employee, the less likely it is that they need to be in a specific location.
It seems to me more and more states and cities are going to have to go the Connecticut way of doing things and keep close tabs on those rich people they’re hoping to get more and more of their revenue from.
That does seem to be the general “strategy” now for high tax locations, such as California.
Posts on the Amazon tax:
- 18 May 2018: Senseless in Seattle: A Panoply of Stupidity
- 18 June 2018: Taxing Tuesday: Mapping Tax Cuts and Laughing at Seattle – after scrapping the Amazon tax, they were trying for a google tax
- 25 September 2018: Taxing Tuesday: Maneuvering to Benefit the Rich, Hope the Suckers Stop Looking, and More – surprising no one, it was discovered that the city council would try an Amazon tax again, when people stopped paying attention
- 7 July 2020: Taxing Tuesday: Seattle Returns to Its Dumbass Idea of an “Amazon Tax” – They figured people stopped paying attention in the middle of pandemic lockdowns
Given that Seattle has decided to outdo itself in dumbassery, I have high hopes I have more to write about the latest iteration of the Amazon tax.
SALT cap zero!
This is another favorite topic, especially since it hits me. I happen to go over the State and Local Tax deduction cap by a few times, but it so happens with the change in marginal tax rates (and some other deductions sitting untouched), it’s a wash for me.
In any case, I’m in favor of a SALT cap of zero (aka, no deductibility of state and local taxes), because I think it will help me in the long run. Those of us in high-tax areas keep seeing our taxes getting raised because the state/local politicians figure we won’t feel the full brunt of the increase, due to the deductibility of SALT.
With the reduced deductibility of SALT (and with the increased standard deductions), they’re standing bare. As I wrote in one of my SALT-cap-related posts: how dare the federal government tax the rich people! We states are the ones who should be taxing them!
Here are a variety of posts where I discuss the SALT cap (just a selection):
- 2 July 2019: Taxing Tuesday: SALT cap zero! Great new taste!
- 15 May 2020: MoneyPalooza Monstrosity! Looking at the SALT Cap Provisions
- 8 October 2019: Taxing Tuesday: Huzzah! Long Live the SALT cap!
- 15 October 2019: Taxing Tuesday: Poor Little Rich People and the SALT Cap
- 18 June 2019: Taxing Tuesday: I’m Sure Suing the Feds will Really Work for New Jersey
- 16 October 2018: Taxing Tuesday: Don’t Blame the SALT Cap for the Pain of High Taxes, Also: The Quest for Trump’s Tax Returns in Tweets
- 7 August 2018: Taxing Tuesday: A Local Discussion on the SALT Cap, and Other State Options
- 23 July 2019: Taxing Tuesday: France (Tries) to Tax American Companies and more SALT Cap Follies
- 11 December 2018: Taxing Tuesday: Not Too Many Interested in Iffy Way to Avoid SALT Cap
Addressing that last item: All throughout 2018, various states tried to come up with “clever” ways for people to get around the SALT cap: via payroll taxes, fake charities, and more. The IRS was having none of it, and, as far as I know, not many people have actually attempted to make this work.
There were some people who took a hit from the TCJA, but they were in some very specific circumstances. I am a high-income person, with 3 kids and a spouse, living in a high-tax state and county.
My effective tax rate for 2018 was:
Federal: 9.4%
Connecticut: 5.1%
New York: 0%Compare against my 2017 rates:
Federal: 10.2% (I actually have a 5-year history, so 2016-2013 went 11.4%, 9.9%, 9.7%, 10.8%)
CT: 5.1%
NY: 0.02% (yes, really)Note: my gross income in 2017 was about $10K higher than in 2018, but the 6 years of history of effective rates represents fluctuations of up to $30K in gross income.
I had a tax cut, basically. A lot of people did, even with the SALT cap. It just wasn’t as big a potential cut as if the marginal rates were reduced and the cap wasn’t there.
As you can see from the list above, the SALT cap looks like a topic we’ll have around, at least until Democrats can take over the White House, House of Reps, and Senate — may happen this fall, of course. And… well, all sorts of things can happen in a few months.
Tax visualizations
I’ve got two favorite things: data visualizations and animated gifs/memes/funny pictures.

Of the two, I love visualizations more:
You may not realize, but I’m really into data visualization.
And, in particular, critiquing data visualizations. Though I would prefer to support good visualizations:
I will pass over the awful graphs from that post, but share some of the graphs I’ve made over the years that I’ve liked.
Taxing Tuesday: Highly Taxed People Running Away – has a graph of federal tax receipts:

Hmmm, not so happy with the color choices there, but the top source is personal income taxes, and below that are payroll taxes.
Corporate income taxes are waaaay less. And no, it’s not something nefarious that corporations tend to pay less in taxes (in total) than their employees do, with most of the taxes coming out of the highest-paid.
There is a whole family of graphs I did, using a tool from the Tax Foundation for people to try to figure out the impact the TCJA would have on them. In Taxing Tuesday: California Chicanery, Geeking Out, And What About Payroll Taxes?, from 13 March 2018, I started out with the simplest situation: a single person filing with the standard deduction. That’s it.
The very boring before/after graph for total taxes paid:
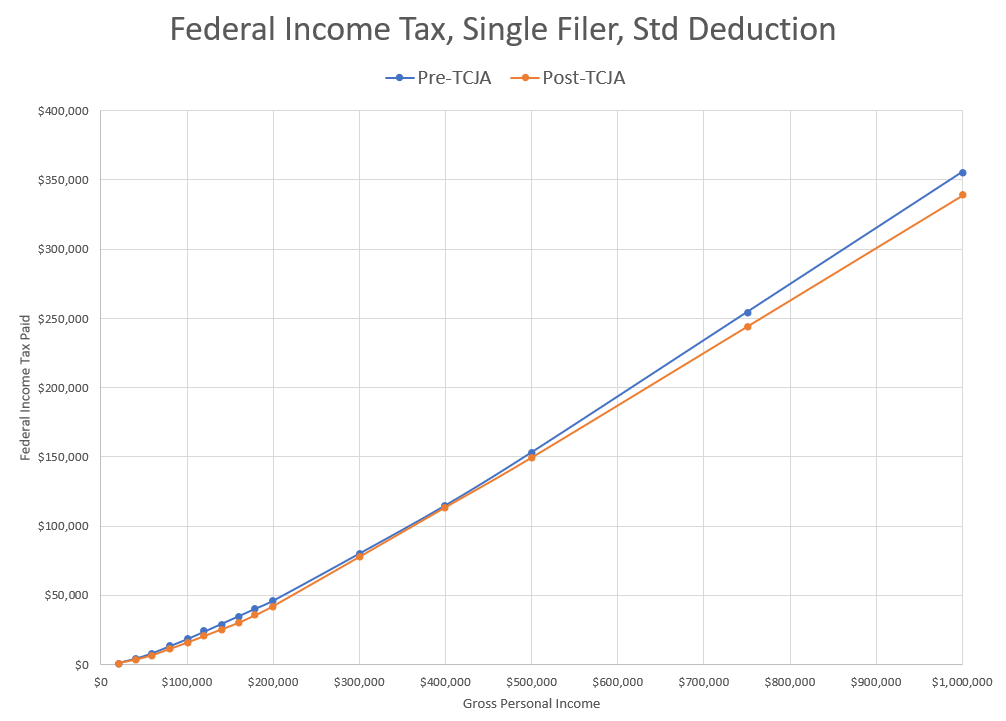
Of course it looks boring due to the scale — I didn’t focus in on the more “normal” income levels, but pushed it all the way up to $1 million.
(yes, I gotta use a gif. I can’t help it)
This is the more interesting-looking graph, where I focus on the differences in absolute dollar amounts and in percentage change:

You can see that yes, the higher the income, the bigger the dollar amount benefit (except for something weird going on from $200K – $400K). But that the largest percentage change was for people around $160K-$180K.
Oh, and the tax rates for the TCJA were still progressive:

I did a whole series of combinations with respect to deductions, SALT, number of children, marital status, etc. I had to work at it to get a situation where people paid more… and it generally was for extremely high-income people.
By the way, the graph doesn’t need to be very complicated for me to like it. In Illinois Finance: Gov. Pritzker’s Tax Proposal from March 2019, I made the following graph:

When it comes to taxes, the percentage point increase vs. percentage increase distinction comes up quite often.
Cartoons, memes, tweets, and more!
Taxes can get quite boring while I peruse the stories, so I like to spice things up in most of my tax posts with tweets, gifs, cartoons, and more.
Here are a few from over the years:
— Illinois Policy (@illinoispolicy) May 19, 2019
Eric Allie’s cartoons from the Illinois Policy Institute pop up a lot in my posts.
Trying to wrap my head around this one. There's a beverage tax…and a soda tax…all for buying 2 waters? pic.twitter.com/P2k2gOOhXi
— Alex Maragos (@AlexMaragosNBC) October 3, 2017
(I told you the Cook County soda tax was applied idiotically)
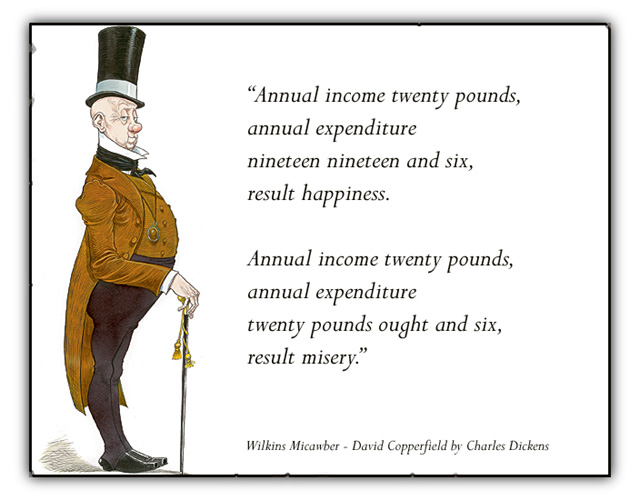
I forgot to mention that I’m a huge Dickens fan, and I especially love the Micawber Principle.

They did remember!
And finally — Illinois, New York, Connecticut, California, and…. — you need to remember to:
Enjoy!
